October 09, 2025 a 03:12 pm


Financial Stocks - Performance Analysis
📊 The financial sector has shown varied performances over the past week, month, and three months. While some stocks demonstrated resilience and growth, others struggled amidst market fluctuations. In this analysis, we will explore the top performers, underperformers, and emerging trends within the financial stocks. Let's dive into the detailed performance data over various time periods to understand the current market dynamics.
Financial Stocks Performance One Week
🔍 Analyzing the one-week performance, VISA has outperformed with a considerable 1.56% gain, followed by SPGI at 1.22%. Most stocks faced downward pressure, notable among them were AXP and BAC, underperforming with declines of 2.02% and 1.26%, respectively. This mixed performance indicates a cautious short-term outlook from investors in the financial sector.
| Stock | Performance (%) | Performance |
|---|---|---|
| VISA | 1.56% | |
| SPGI | 1.22% | |
| BRK.B | 0.79% | |
| GS | -0.33% | |
| MA | -0.15% | |
| PGR | -0.15% | |
| WFC | -0.95% | |
| JPM | -1.13% | |
| BAC | -1.26% | |
| AXP | -2.02% |
Financial Stocks Performance One Month
📈 Over the past month, VISA and JPM rose to the occasion with gains of 2.26% and 2.11%, respectively. SPGI, however, faced a significant setback with a 12.36% drop. This decline requires further investigation for underlying causes, such as external economic factors or company-specific challenges.
| Stock | Performance (%) | Performance |
|---|---|---|
| VISA | 2.26% | |
| JPM | 2.11% | |
| GS | 1.75% | |
| BRK.B | 1.45% | |
| PGR | -0.02% | |
| AXP | -0.03% | |
| BAC | -0.80% | |
| WFC | -1.15% | |
| MA | -1.18% | |
| SPGI | -12.36% |
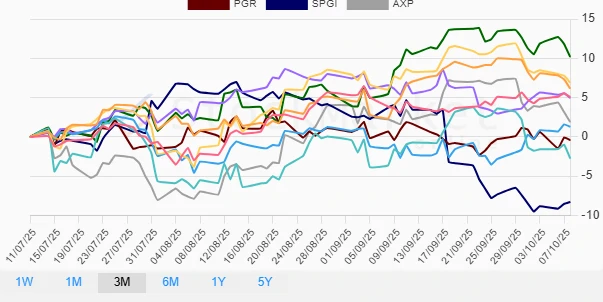
Financial Stocks Performance Three Months
✅ Over a three-month horizon, GS showed remarkable strength with a 10.17% increase, positioning itself as the top performer. BAC and JPM also showed solid upward momentum. On the flip side, WFC and SPGI have notably underperformed, with declines of 2.73% and 8.29% respectively. This reflects potential volatility and sector-specific risks affecting certain companies more than others.
| Stock | Performance (%) | Performance |
|---|---|---|
| GS | 10.17% | |
| BAC | 6.90% | |
| JPM | 6.14% | |
| BRK.B | 5.07% | |
| MA | 4.95% | |
| AXP | 1.89% | |
| VISA | 1.29% | |
| PGR | -0.42% | |
| WFC | -2.73% | |
| SPGI | -8.29% |
Summary
💡 In summary, the financial sector has shown a mix of strength and vulnerability across different time periods. Short-term fluctuations are apparent, with VISA and JPM showing strong recent performances. Over three months, GS, BAC, and JPM have proven their resilience. However, consistent underperformance from SPGI highlights potential weaknesses that warrant further scrutiny. Investors should remain vigilant and consider both market conditions and company-specific factors when making decisions in this sector.
Smart Data Insight
Master the Perfect Entry & Exit for this Stock
Don't leave your profits to chance. Historically, this stock follows specific seasonal patterns that institutional traders use to maximize returns.
- ✅ Identify the "Golden Buying Window"
- ✅ Avoid high-risk correction cycles
- ✅ Backtested data from the last 20+ years