August 07, 2025 a 03:12 pm


Financial Stocks - Performance Analysis
📊 The financial sector remains a pivotal component of the global market landscape. Recent trends highlight a mixed tableau of performance across various timeframes, with a blend of resilience and challenges. While some stocks depict robust growth, others falter under market pressures. Let's delve into a detailed review of the financial stocks' performance over distinct periods.
Financial Stocks Performance One Week
🔍 The past week has showcased a blend of gains and losses among major financial stocks. Notably, Progressive Corp (PGR) and S&P Global Inc. (SPGI) emerged as the top gainers, reflecting their resilience even amidst broader market volatility. Conversely, Bank of America (BAC) and Wells Fargo (WFC) faced significant downward pressures. The week underscores the diverse responses of institutions to current market dynamics.
| Stock | Performance (%) | Performance |
|---|---|---|
| PGR | 2.26 | |
| SPGI | 2.11 | |
| MA | 0.50 | |
| GS | 0.20 | |
| BRK.B | -0.57 | |
| AXP | -1.23 | |
| VISA | -1.64 | |
| JPM | -1.62 | |
| WFC | -3.75 | |
| BAC | -3.93 |
Financial Stocks Performance One Month
📈 Over the last month, S&P Global Inc. (SPGI) and Goldman Sachs (GS) have been at the forefront of growth, reflecting strong market confidence and strategic positioning. On the other end, American Express (AXP) and Visa (VISA) exhibited notable declines, suggesting challenges within the consumer finance landscape. This diversity in performance highlights underlying sectoral shifts.
| Stock | Performance (%) | Performance |
|---|---|---|
| SPGI | 6.81 | |
| GS | 3.99 | |
| JPM | 3.11 | |
| MA | 1.29 | |
| PGR | -1.48 | |
| BRK.B | -1.74 | |
| BAC | -3.60 | |
| VISA | -4.17 | |
| WFC | -4.67 | |
| AXP | -6.76 |
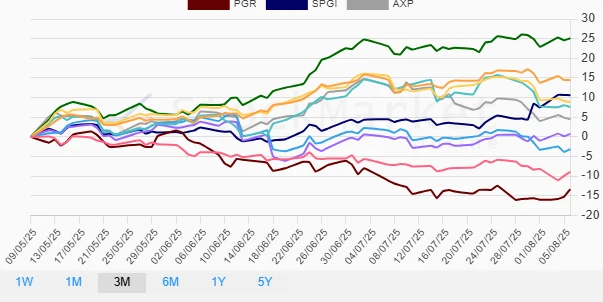
Financial Stocks Performance Three Months
📉 In the last three months, Goldman Sachs (GS) and JPMorgan Chase & Co. (JPM) led the charge with impressive gains, signalling strong market positioning and effective strategy execution. Progressive Corp (PGR) and Berkshire Hathaway (BRK.B), however, have struggled, highlighting potential vulnerabilities or strategic missteps. This period presents an intricate picture of market forces and institutional adaptability.
| Stock | Performance (%) | Performance |
|---|---|---|
| GS | 25.09 | |
| JPM | 14.47 | |
| SPGI | 10.59 | |
| BAC | 8.83 | |
| WFC | 7.57 | |
| AXP | 4.51 | |
| MA | 0.71 | |
| VISA | -3.15 | |
| BRK.B | -8.93 | |
| PGR | -13.35 |
Summary
💡 Overall, the financial sector has shown a varied performance across the evaluated periods. Stocks such as Goldman Sachs (GS) and JPMorgan (JPM) have demonstrated significant strength, highlighting strategic agility and market adeptness. Conversely, companies like Progressive Corp (PGR) and Berkshire Hathaway (BRK.B) have underperformed, suggesting areas for strategic reassessment. Moving forward, stakeholders should continue monitoring these trends to navigate potential investment opportunities or risks within the financial domain. The diverse performance patterns indicate both potential for growth and caution within the sector. Strategic investors might leverage this data to recalibrate portfolios in alignment with these insights.
Smart Data Insight
Master the Perfect Entry & Exit for this Stock
Don't leave your profits to chance. Historically, this stock follows specific seasonal patterns that institutional traders use to maximize returns.
- ✅ Identify the "Golden Buying Window"
- ✅ Avoid high-risk correction cycles
- ✅ Backtested data from the last 20+ years