November 06, 2025 a 03:13 pm


Financial Stocks - Performance Analysis 📊
The financial sector has exhibited diverse performance results across different time frames, reflecting a dynamic market environment. In the recent quarters, fluctuations have been driven by macroeconomic factors, regulatory changes, and shifts in consumer behavior. This analysis delves into the performance metrics of key financial stocks over the past week, month, and three months, highlighting top performers and identifying trends.
Financial Stocks Performance One Week 📈
In the one-week snapshot, Berkshire Hathaway (BRK.B) outperformed its peers, showing resilience with a 2.16% gain. American Express (AXP) and S&P Global (SPGI) also emerged as strong contenders. In contrast, Visa (V) struggled with the biggest decline, indicating potential headwinds or market skepticism about its short-term trajectory.
| Stock | Performance (%) | Performance |
|---|---|---|
| BRK.B | 2.16 | |
| AXP | 1.93 | |
| SPGI | 1.14 | |
| WFC | 1.12 | |
| PGR | 0.99 | |
| JPM | 0.73 | |
| GS | 0.38 | |
| MA | -0.04 | |
| BAC | -1.08 | |
| VISA | -1.44 |
Financial Stocks Performance One Month 📉
The one-month performance reveals American Express (AXP) as the standout performer with an impressive 11.34% rise, suggesting strong operational performance and positive investor sentiment. Meanwhile, Progressive (PGR) faced significant challenges, declining by 15.08%, possibly due to adverse claims experience or macroeconomic pressures impacting the insurance sector.
| Stock | Performance (%) | Performance |
|---|---|---|
| AXP | 11.34 | |
| WFC | 7.40 | |
| BAC | 4.51 | |
| SPGI | 3.53 | |
| JPM | 1.47 | |
| GS | 0.70 | |
| BRK.B | -2.63 | |
| VISA | -3.43 | |
| MA | -4.53 | |
| PGR | -15.08 |
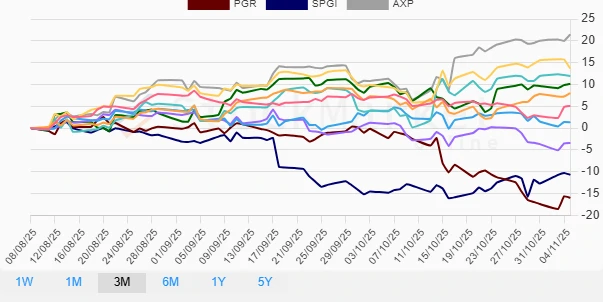
Financial Stocks Performance Three Months ⚠️
Over the past three months, American Express (AXP) and Bank of America (BAC) have dominated, reflecting robust growth trajectories with both stocks benefiting from strategic integrations and favorable market conditions. On the downside, Progressive (PGR) continues to be under pressure, likely impacted by operational inefficiencies or claims volatility.
| Stock | Performance (%) | Performance |
|---|---|---|
| AXP | 21.45 | |
| BAC | 13.68 | |
| WFC | 11.94 | |
| GS | 10.13 | |
| JPM | 8.02 | |
| BRK.B | 5.08 | |
| VISA | 1.32 | |
| MA | -3.40 | |
| SPGI | -10.68 | |
| PGR | -15.94 |
Summary and Conclusion ✅
Throughout the analyzed periods, American Express (AXP) demonstrated consistent upward momentum across all time frames, making it a standout performer. However, Progressive (PGR) struggled significantly, signaling potential internal obstacles or adverse market conditions. Investors should maintain their vigilance on macroeconomic indicators and consider sector-specific developments for strategic investment decisions. These performance insights can guide allotment and hedging strategies for optimizing portfolio returns within the financial sector.
Smart Data Insight
Master the Perfect Entry & Exit for this Stock
Don't leave your profits to chance. Historically, this stock follows specific seasonal patterns that institutional traders use to maximize returns.
- ✅ Identify the "Golden Buying Window"
- ✅ Avoid high-risk correction cycles
- ✅ Backtested data from the last 20+ years