
November 05, 2026 a 03:12 pm


Financial Stocks - Performance Analysis
The financial sector has exhibited dynamic performance over the past few months, with considerable fluctuations reflecting broader economic sentiments. Various key players within this sector have demonstrated both resilience and volatility, showcasing mixed results across different time frames. This analysis delves into the performances across weekly, monthly, and quarterly scopes, emphasizing top performers and laggards within this critical market segment.
📊 Financial Stocks Performance One Week
The one-week performance in the financial sector shows a strong upward momentum for several stocks. Notably, Berkshire Hathaway (BRK.B) leads with a solid 6.73% gain, followed closely by Visa (6.26%) and Mastercard (5.79%). S&P Global and Wells Fargo also reported impressive gains, signaling positive investor sentiment. Overall, the sector illustrates a robust week with minimal underperformance. The detailed performance analysis for the week is as follows:
| Stock | Performance (%) | Performance |
|---|---|---|
| BRK.B | 6.73 | |
| VISA | 6.26 | |
| MA | 5.79 | |
| SPGI | 4.57 | |
| WFC | 3.13 | |
| AXP | 2.78 | |
| JPM | 2.57 | |
| PGR | 2.05 | |
| BAC | 1.06 | |
| GS | 0.16 |
📈 Financial Stocks Performance One Month
The one-month performance reveals significant upward trends, especially for S&P Global, which tops the list with a remarkable 19.87% gain. Mastercard and Visa also show formidable growth, both above 16%. Conversely, Bank of America exhibited a loss, indicating challenges in this particular banking segment. These mixed results underscore divergent performances within the sector, driven likely by varied external and internal factors affecting financial stocks.
| Stock | Performance (%) | Performance |
|---|---|---|
| SPGI | 19.87 | |
| MA | 17.49 | |
| VISA | 16.65 | |
| PGR | 10.54 | |
| AXP | 9.04 | |
| WFC | 7.29 | |
| BRK.B | 13.75 | |
| JPM | 6.28 | |
| GS | 3.68 | |
| BAC | -4.37 |
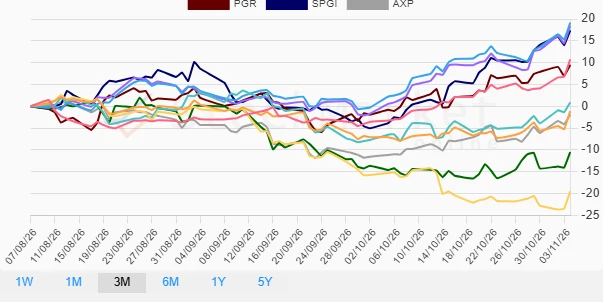
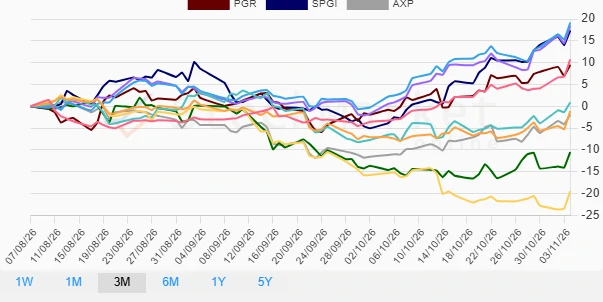
📉 Financial Stocks Performance Three Months
Over the three-month period, the sector presents a blend of robust gains and notable declines. Visa and Mastercard continue to dominate with gains above 18%. Meanwhile, Bank of America and Goldman Sachs are confronted with substantial declines. The mixed performances indicate a sector grappling with disparate market pressures, warranting close monitoring for potential tactical adjustments.
| Stock | Performance (%) | Performance |
|---|---|---|
| VISA | 19.13 | |
| MA | 18.38 | |
| SPGI | 17.35 | |
| BRK.B | 10.73 | |
| PGR | 9.46 | |
| WFC | 0.88 | |
| JPM | -1.12 | |
| AXP | -1.93 | |
| GS | -10.51 | |
| BAC | -19.49 |
✅ Summary
The financial sector's recent performance highlights an asymmetrical landscape, showcasing a blend of significant gains and marked declines. Notably, payment processors and information service companies lead the charge, while major banks show a divergence in performance, emphasizing the need for precise market alignment and possible risk mitigation strategies. Investors should remain vigilant, considering macroeconomic variables and sector-specific dynamics as they position themselves within this critical industry.
Smart Data Insight
Master the Perfect Entry & Exit for this Stock
Don't leave your profits to chance. Historically, this stock follows specific seasonal patterns that institutional traders use to maximize returns.
- ✅ Identify the "Golden Buying Window"
- ✅ Avoid high-risk correction cycles
- ✅ Backtested data from the last 20+ years