
March 05, 2026 a 03:12 pm


Financial Stocks - Performance Analysis
📊 In the recent evaluation of financial sector stocks, fluctuating market dynamics are evident across various timeframes. Certain stocks have displayed resilience, delving into positive territory, while others have succumbed to market pressures. Insight into these performance trends provides a strategic advantage for investors seeking to optimize portfolio decisions.
📈 Financial Stocks Performance One Week
| Stock | Performance (%) | Performance |
|---|---|---|
| SPGI | 1.82% | |
| MA | 1.57% | |
| VISA | 1.20% | |
| PGR | -0.15% | |
| JPM | -2.19% | |
| WFC | -2.59% | |
| BRK.B | -2.94% | |
| BAC | -3.78% | |
| GS | -6.58% | |
| AXP | -7.13% |
📅 Financial Stocks Performance One Month
| Stock | Performance (%) | Performance |
|---|---|---|
| PGR | 5.26% | |
| SPGI | -4.08% | |
| MA | -4.85% | |
| JPM | -4.68% | |
| VISA | -2.37% | |
| BRK.B | -1.07% | |
| GS | -7.25% | |
| BAC | -7.52% | |
| WFC | -8.99% | |
| AXP | -10.83% |
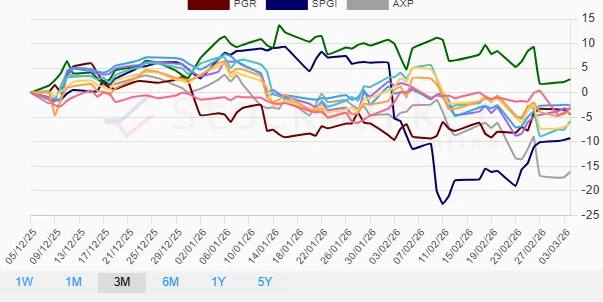
📅 Financial Stocks Performance Three Months
| Stock | Performance (%) | Performance |
|---|---|---|
| GS | 2.72% | |
| BRK.B | -3.01% | |
| MA | -3.43% | |
| JPM | -4.18% | |
| VISA | -2.57% | |
| WFC | -5.85% | |
| PGR | -4.37% | |
| BAC | -6.30% | |
| SPGI | -9.28% | |
| AXP | -16.12% |
🔍 Summary
In conclusion, the financial stocks exhibited mixed performances across the evaluated periods. While American Express (AXP) consistently underperformed, S&P Global Inc. (SPGI) and Goldman Sachs (GS) showed short-term gains. Investors are advised to scrutinize the broader economic indicators and company-specific developments before making strategic decisions, recognizing both the risks and potential growth opportunities.
Smart Data Insight
Master the Perfect Entry & Exit for this Stock
Don't leave your profits to chance. Historically, this stock follows specific seasonal patterns that institutional traders use to maximize returns.
- ✅ Identify the "Golden Buying Window"
- ✅ Avoid high-risk correction cycles
- ✅ Backtested data from the last 20+ years