February 05, 2026 a 03:12 pm


Financial Stocks - Performance Analysis
In the ever-evolving landscape of financial markets, stock performance serves as a crucial barometer for investor sentiment and sector vitality. The latest data reveal significant fluctuations among the top financial stocks, reflecting broader economic conditions and institutional maneuvers. We delve into weekly, monthly, and quarterly performances to uncover patterns and insights vital for strategic decision-making amidst volatility.
📊 Financial Stocks Performance One Week
| Stock | Performance (%) | Performance |
|---|---|---|
| BRK.B | 5.55% | |
| BAC | 4.28% | |
| JPM | 3.52% | |
| WFC | 2.74% | |
| MA | 1.84% | |
| VISA | -0.43% | |
| PGR | -1.25% | |
| AXP | -1.33% | |
| GS | -2.85% | |
| SPGI | -12.03% |
📊 Financial Stocks Performance One Month
| Stock | Performance (%) | Performance |
|---|---|---|
| BRK.B | 1.05% | |
| PGR | -2.93% | |
| BAC | -3.09% | |
| WFC | -3.14% | |
| GS | -4.23% | |
| MA | -4.44% | |
| JPM | -5.04% | |
| VISA | -7.78% | |
| AXP | -7.79% | |
| SPGI | -13.89% |
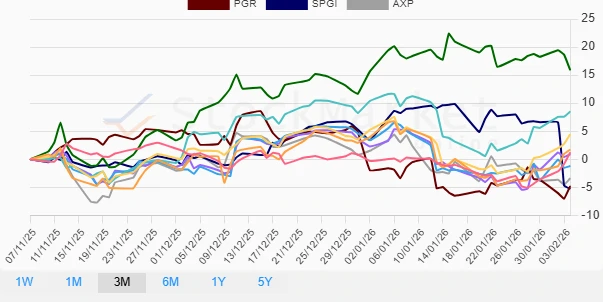
📊 Financial Stocks Performance Three Months
| Stock | Performance (%) | Performance |
|---|---|---|
| GS | 15.91% | |
| WFC | 8.50% | |
| BAC | 4.47% | |
| JPM | 1.72% | |
| BRK.B | 1.20% | |
| MA | 0.90% | |
| VISA | -1.21% | |
| AXP | -3.38% | |
| PGR | -4.78% | |
| SPGI | -5.26% |
🔍 Summary
The financial sector has experienced notable volatility across the analyzed periods. In the one-week timeframe, Berkshire Hathaway emerged as a strong performer, while S&P Global saw significant declines. Over the monthly period, most stocks reflected negative returns with S&P Global again showcasing major underperformance. The three-month analysis highlighted Goldman Sachs as a standout winner, driven by strategic moves likely in line with broader economic recovery or internal efficiencies. These findings suggest varying underlying factors across the sector, urging cautious but informed approaches to investment decisions.