
September 03, 2026 a 03:12 pm


Financial Stocks - Performance Analysis
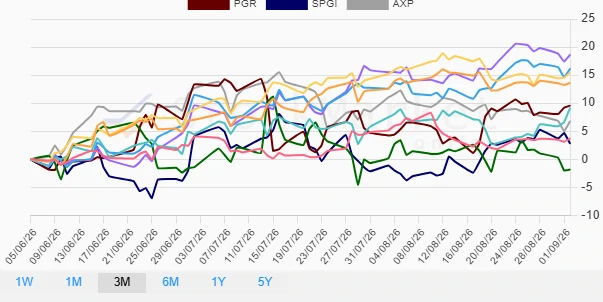
In the recent financial market landscape, stocks within the financials sector have exhibited varying degrees of performance across different time frames. This analysis unravels the performance metrics for key players over one week, one month, and three-month periods, providing insights into the fluctuations and underlying trends that informed these results.
Financial Stocks Performance One Week 📊
| Stock | Performance (%) | Performance |
|---|---|---|
| WFC | 4.98 | |
| BAC | 2.33 | |
| PGR | 1.70 | |
| JPM | 0.57 | |
| BRK.B | 0.31 | |
| VISA | -0.30 | |
| MA | -0.59 | |
| AXP | -1.22 | |
| GS | -3.53 | |
| SPGI | -0.80 |
Financial Stocks Performance One Month 📈
| Stock | Performance (%) | Performance |
|---|---|---|
| PGR | 5.18 | |
| SPGI | 4.74 | |
| MA | 3.10 | |
| VISA | 2.51 | |
| WFC | 1.14 | |
| JPM | -0.31 | |
| BAC | -0.36 | |
| BRK.B | -2.24 | |
| GS | -4.50 | |
| AXP | -4.78 |
Financial Stocks Performance Three Months 📉
| Stock | Performance (%) | Performance |
|---|---|---|
| MA | 18.64 | |
| VISA | 16.18 | |
| BAC | 15.51 | |
| JPM | 13.61 | |
| PGR | 9.57 | |
| WFC | 9.18 | |
| AXP | 6.82 | |
| BRK.B | 3.71 | |
| SPGI | 2.76 | |
| GS | -1.81 |
Summary 💡
The financial sector exhibited significant stock performance variances over the examined periods. One-week data highlights the volatility and sensitivity of financial stocks to short-term market events, with WFC being the standout positive performer and GS struggling. Over a month, PGR and SPGI emerged robustly, while AXP lagged. Over three months, MA and VISA showcased substantial growth, confirming resilience and investor confidence. Critical attention should be given to balancing portfolios with a blend of these stocks to optimize risk-adjusted returns.
Smart Data Insight
Master the Perfect Entry & Exit for this Stock
Don't leave your profits to chance. Historically, this stock follows specific seasonal patterns that institutional traders use to maximize returns.
- ✅ Identify the "Golden Buying Window"
- ✅ Avoid high-risk correction cycles
- ✅ Backtested data from the last 20+ years