
October 01, 2026 a 03:12 pm

Financial Stocks - Performance Analysis
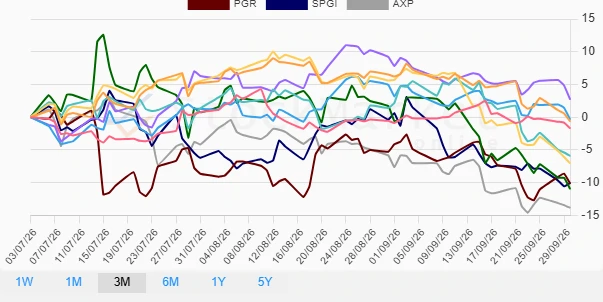
Analyzing the financial stocks over various timeframes provides insight into market dynamics and investor sentiment. Over the past week, month, and quarter, a diverse range of performances is evident, highlighting the varying impacts of macroeconomic factors and company-specific developments. Identifying winner and loser stocks helps investors make informed decisions tailored to their risk appetite and investment goals.
📊 Financial Stocks Performance One Week
| Stock | Performance (%) | Performance |
|---|---|---|
| PGR | 2.56 | |
| AXP | -0.50 | |
| BRK.B | -1.44 | |
| JPM | -2.28 | |
| SPGI | -2.19 | |
| VISA | -2.36 | |
| GS | -2.46 | |
| MA | -2.58 | |
| WFC | -2.58 | |
| BAC | -2.85 |
📈 Financial Stocks Performance One Month
| Stock | Performance (%) | Performance |
|---|---|---|
| BRK.B | -0.82 | |
| VISA | -3.53 | |
| MA | -5.13 | |
| PGR | -6.00 | |
| AXP | -6.21 | |
| JPM | -6.87 | |
| WFC | -8.09 | |
| GS | -10.40 | |
| SPGI | -10.68 | |
| BAC | -12.74 |
📉 Financial Stocks Performance Three Months
| Stock | Performance (%) | Performance |
|---|---|---|
| MA | 2.70 | |
| VISA | -0.35 | |
| JPM | -0.66 | |
| BRK.B | -1.72 | |
| WFC | -5.92 | |
| SPGI | -10.05 | |
| PGR | -10.14 | |
| GS | -10.98 | |
| BAC | -7.05 | |
| AXP | -13.85 |
💡 Summary
The financial sector has shown varied performance across the analyzed periods, with a general trend of decline noted across the majority of stocks, particularly over the monthly and quarterly timeframes. Notably, Progressive Corporation (PGR) outperformed in the weekly analysis, while Mastercard (MA) showed resilience over the three-month period. However, persistent underperformance by stocks such as Bank of America (BAC), American Express (AXP), and Goldman Sachs (GS) highlights challenges that could be attributed to broader economic pressures and sector-specific issues. Investors should exercise caution and consider diversification strategies to mitigate risks in the current economic climate.
Smart Data Insight
Master the Perfect Entry & Exit for this Stock
Don't leave your profits to chance. Historically, this stock follows specific seasonal patterns that institutional traders use to maximize returns.
- ✅ Identify the "Golden Buying Window"
- ✅ Avoid high-risk correction cycles
- ✅ Backtested data from the last 20+ years