
July 16, 2026 a 08:00 am
F: Fundamental Ratio Analysis - Ford Motor Company
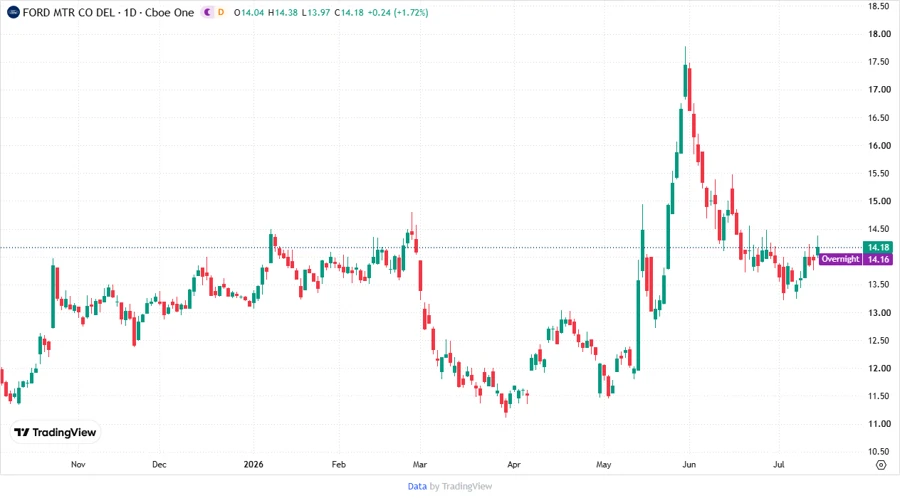
Ford Motor Company, a leader in the automotive industry, has faced fluctuations in its stock performance amidst evolving market conditions. Future prospects appear mixed as the company continues to innovate in electric vehicles while managing existing operational challenges. Investors are advised to carefully consider broader industry trends and specific company developments.
Fundamentals Rating
Based on recent data, Ford's fundamental rating indicates moderate financial health with room for improvement in several areas.
| Category | Score | Visualization |
|---|---|---|
| Discounted Cash Flow | 5 | |
| Return on Equity | 1 | |
| Return on Assets | 1 | |
| Debt to Equity | 1 | |
| Price to Earnings | 1 | |
| Price to Book | 4 |
Historical Rating
A look at Ford's historical scores highlights shifts in financial stability over time.
| Date | Overall | DCF | ROE | ROA | Debt/Equity | P/E | P/B |
|---|---|---|---|---|---|---|---|
| 2026-07-15 | 2 | 5 | 1 | 1 | 1 | 1 | 4 |
| Previous | 0 | 5 | 1 | 1 | 1 | 1 | 4 |
Analyst Targets
Analyst price targets suggest a potential upside for cautious investors, though volatility should be expected.
| High | Low | Median | Consensus |
|---|---|---|---|
| 17 | 13 | 15.25 | 15.13 |
Analyst Sentiment
The overall sentiment among analysts is tepid, indicating a large portion suggesting to hold.
| Recommendation | Count | Visualization |
|---|---|---|
| Strong Buy | 0 | |
| Buy | 16 | |
| Hold | 25 | |
| Sell | 6 | |
| Strong Sell | 0 |
Conclusion
Ford Motor Company remains a critical player in the automotive sector with significant potential but faces challenges in terms of profitability and capital management. The transition to electric vehicles could provide opportunities, albeit amid high competition and necessary investments. Financial metrics indicate some risks, underlining the importance of careful monitoring. While analyst sentiment aligns towards a hold, individual risk tolerance and market conditions should guide investment decisions.
Smart Data Insight
Master the Perfect Entry & Exit for this Stock
Don't leave your profits to chance. Historically, this stock follows specific seasonal patterns that institutional traders use to maximize returns.
- ✅ Identify the "Golden Buying Window"
- ✅ Avoid high-risk correction cycles
- ✅ Backtested data from the last 20+ years