June 15, 2025 a 04:44 pm
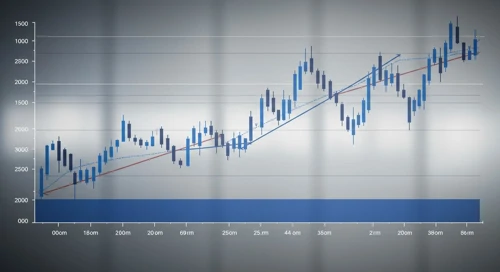

F: Fibonacci Analysis - Ford Motor Company
The Ford Motor Company has shown resilience in an evolving automotive market, capitalizing on growth in electric vehicle innovations and strengthening its presence globally. Despite facing challenges, Ford's ability to leverage technology and strategic partnerships indicates positive future prospects. As investors focus on Ford's transition to sustainable solutions, the stock presents varied opportunities in the current market landscape.
Fibonacci Analysis
| Details | Information |
|---|---|
| Start Date | 2024-11-25 |
| End Date | 2025-06-06 |
| High Point | $11.40 on 2024-11-25 |
| Low Point | $9.14 on 2025-04-10 |
| Fibonacci Level | Price |
|---|---|
| 0.236 | $9.62 |
| 0.382 | $9.97 |
| 0.5 | $10.27 |
| 0.618 | $10.57 |
| 0.786 | $10.97 |
The current price is $10.43, which is within the 0.5 Fibonacci retracement level. Technically, this area could serve as a potential support level, given the stock stabilizes around this price.
Conclusion
Ford Motor Company's stock exhibits a retracement scenario, indicating a consolidation phase post the initial downtrend. Investors should closely monitor the stock's performance around the 0.5 retracement level for potential support, especially as Ford navigates strategic changes and market conditions. Ford's focus on electric vehicle production and global expansion offers growth opportunities. However, challenges in supply chain and market competition remain significant risks, necessitating prudent investment strategies. Overall, Ford's trajectory in adopting sustainable practices may substantially influence its long-term valuation.
Smart Data Insight
Master the Perfect Entry & Exit for this Stock
Don't leave your profits to chance. Historically, this stock follows specific seasonal patterns that institutional traders use to maximize returns.
- ✅ Identify the "Golden Buying Window"
- ✅ Avoid high-risk correction cycles
- ✅ Backtested data from the last 20+ years