May 17, 2026 a 07:46 am


F: Dividend Analysis - Ford Motor Company
Ford Motor Company has demonstrated a robust dividend history but faces challenges with negative EPS payout ratios. Although the dividend yield is attractive, the company's profitability metrics highlight potential risks. Strategic financial management will be crucial for sustaining future dividend payouts and improving investor confidence.
Overview 📊
Ford Motor Company presents a compelling dividend profile with notable yield and history.
| Metric | Value |
|---|---|
| Sector | Automotive |
| Dividend yield | 5.00 % |
| Current dividend per share | 0.75 USD |
| Dividend history | 22 years |
| Last cut or suspension | None |
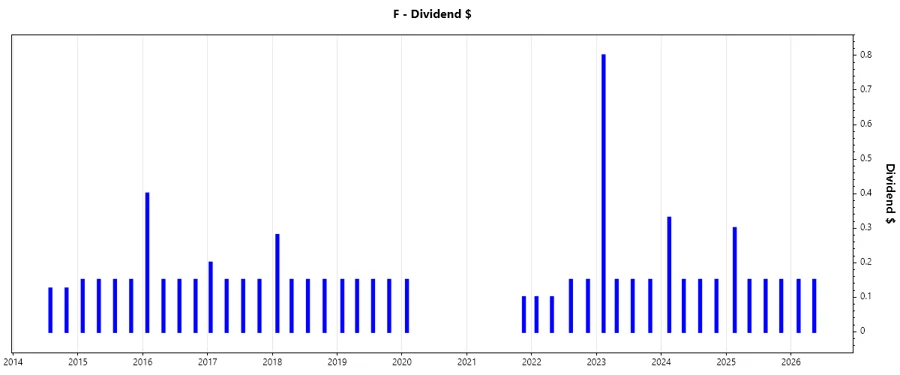
Dividend History 🗣️
A strong dividend history is indicative of a company's consistent cash flow and profitability, making it an attractive investment for income-focused investors.
| Year | Dividend per Share (USD) |
|---|---|
| 2026 | 0.30 |
| 2025 | 0.75 |
| 2024 | 0.78 |
| 2023 | 1.25 |
| 2022 | 0.50 |
Dividend Growth 📈
Dividend growth reflects a company's capacity to increase shareholder returns over time, contributing to long-term investment value.
| Time | Growth |
|---|---|
| 3 years | 14.47 % |
| 5 years | 37.97 % |
The average dividend growth is 37.97% over 5 years. This shows moderate but steady dividend growth.
Payout Ratio 📉
Payout ratios are crucial indicators of a company's ability to sustain dividend payments, reflecting financial health and reinvestment strategies.
| Key figure | Ratio |
|---|---|
| EPS-based | -49.11 % |
| Free cash flow-based | 24.66 % |
The EPS-based payout ratio of -49.11% indicates unsustainable dividends from earnings, while the FCF payout of 24.66% suggests support from operational cashflows.
Cashflow & Capital Efficiency ✅
An analysis of cash flow trends is essential to understanding a company's ability to fund operations and dividends while managing capital efficiently.
| Key Metric | 2025 | 2024 | 2023 |
|---|---|---|---|
| Free Cash Flow Yield | 23.88 % | 17.11 % | 13.71 % |
| Earnings Yield | -15.67 % | 14.93 % | 8.92 % |
| CAPEX to Operating Cash Flow | 41.42 % | 56.31 % | 55.21 % |
| Stock-based Compensation to Revenue | 0.27 % | 0.28 % | 0.26 % |
| Free Cash Flow / Operating Cash Flow Ratio | 58.58 % | 43.69 % | 44.79 % |
The data show strong FCF yields but highlight issues in capital allocation, affecting earnings reinvested for growth.
Balance Sheet & Leverage Analysis ⚠️
Balance sheet analysis helps assess financial stability and leverage, influencing risk and investment returns.
| Key Metric | 2025 | 2024 | 2023 |
|---|---|---|---|
| Debt-to-Equity | 466.10 % | 358.79 % | 353.28 % |
| Debt-to-Assets | 57.95 % | 56.40 % | 55.29 % |
| Debt-to-Capital | 82.34 % | 78.20 % | 77.94 % |
| Net Debt to EBITDA | 16.91 | 12.58 | 10.61 |
| Current Ratio | 1.09 | 1.16 | 1.20 |
| Quick Ratio | 0.94 | 1.02 | 1.04 |
| Financial Leverage | 8.04 | 6.36 | 6.39 |
The high debt levels pose a risk, demanding careful management to assure liquidity and operational flexibility in volatile markets.
Fundamental Strength & Profitability 📈
Assessing profitability ratios and margins offers insights into the company's core operational efficiency and capacity to generate profit.
| Key Metric | 2025 | 2024 | 2023 |
|---|---|---|---|
| Return on Equity | -22.76 % | 13.11 % | 10.16 % |
| Return on Assets | -2.83 % | 2.06 % | 1.59 % |
| Margins: Net | -4.37% | 3.18% | 2.47% |
| Margins: EBIT | 1.35% | 2.75% | 3.05% |
| Margins: EBITDA | 4.55% | 5.93% | 6.75% |
| Margins: Gross | 12.18% | 12.65% | 13.80% |
Profitability challenges, notably negative ROE, underscore vulnerability that requires operational refinement and strategic shifts.
Price Development 📉
Dividend Scoring System ✅
| Category | Score (Out of 5) | Score Bar |
|---|---|---|
| Dividend yield | 5 | |
| Dividend Stability | 3 | |
| Dividend growth | 3 | |
| Payout ratio | 2 | |
| Financial stability | 2 | |
| Dividend continuity | 4 | |
| Cashflow Coverage | 4 | |
| Balance Sheet Quality | 2 |
Overall Score: 25 out of 40
Rating 🗣️
Ford Motor Company's dividend profile is a mix of promising yield and challenging payout ratios. Investors are advised to consider the balance between current income potential and the financial health indicators suggesting a need for strategic financial management improvements. While the dividend remains an attractive aspect, caution around the ongoing profitability and debt management is recommended.
Smart Data Insight
Master the Perfect Entry & Exit for this Stock
Don't leave your profits to chance. Historically, this stock follows specific seasonal patterns that institutional traders use to maximize returns.
- ✅ Identify the "Golden Buying Window"
- ✅ Avoid high-risk correction cycles
- ✅ Backtested data from the last 20+ years