April 24, 2026 a 07:31 am

📊 Dividend Analysis - Ford Motor Company
Ford Motor Company has been a staple in the automotive industry, known for innovation and historical reliability. Despite recent financial hurdles evident from its negative EPS-based payout ratio, its dividend attractiveness persists due to a historical yield that exceeds many industry peers. Investors should weigh the short-term financial metrics against Ford's long legacy and brand strength when considering it for dividend income.
Overview 🗣️
Ford offers a competitive dividend yield at 4.25%, indicative of its value proposition to income-focused investors. Although the company has faced dividend suspensions in the past, its history of 22 years without a cut is reassuring to some extent. Yet, cautious monitoring of its financial health is required to maintain confidence in its dividend sustainability.
| Metric | Details |
|---|---|
| Sector | Automotive |
| Dividend Yield | 4.25% |
| Current Dividend per Share | 0.75 USD |
| Dividend History | 22 years |
| Last Cut or Suspension | None |
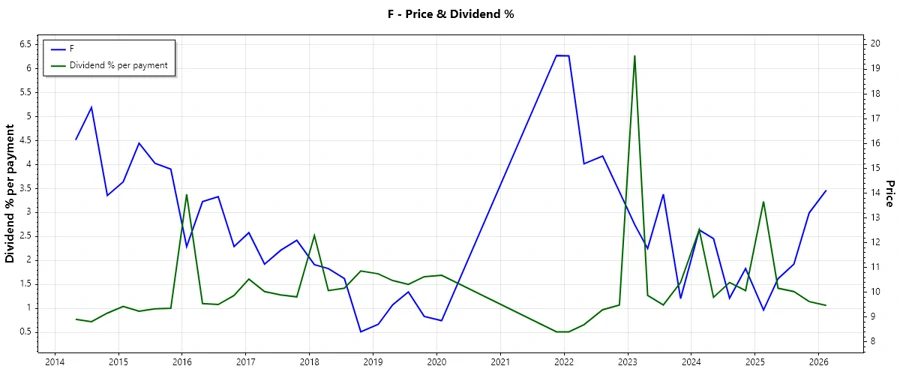
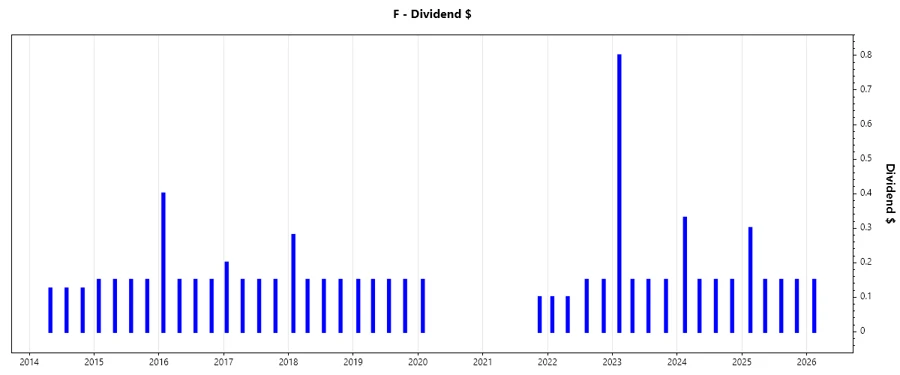
Dividend History 📉
Tracking the dividend history is crucial for evaluating payment consistency and predicting future yield stability. Ford's oscillating dividend history, punctuated by cuts during financial downturns, requires investors to balance caution with opportunity.
| Year | Dividend per Share (USD) |
|---|---|
| 2026 | 0.15 |
| 2025 | 0.75 |
| 2024 | 0.78 |
| 2023 | 1.25 |
| 2022 | 0.50 |
Dividend Growth 📈
The examination of Ford's dividend growth reflects a volatile history with a modest upward trend: 14.47% growth over three years and 37.97% over five years. This suggests a resilient yet cautious growth trajectory, contingent on financial performance.
| Time | Growth |
|---|---|
| 3 years | 14.47% |
| 5 years | 37.97% |
The average dividend growth of 37.97% over five years indicates moderate yet steady growth, providing a buffer against inflation and enhancing long-term investor returns.
Payout Ratio ⚠️
Payout ratios can reveal the sustainability of dividends. Ford's negative EPS payout ratio, due to negative earnings, contrasts with a moderate free cash flow payout of 23.61%, which aligns with the firm's ability to support dividends through cash generation rather than profits alone.
| Key figure | Ratio |
|---|---|
| EPS-based | -36.53% |
| Free cash flow-based | 23.61% |
The stark contrast between EPS and FCF-based payout ratios highlights the reliance on cash flow for dividend payments, raising caution about profitability sustainability.
Cashflow & Capital Efficiency ✅
Financial stability is often underpinned by cash flow and capital efficiency metrics. Ford’s recent historical trend shows a satisfactory free cash flow yield, with a moderate CAPEX to operating cash flow ratio, indicating working capital investment capability despite challenging conditions.
| Metric | 2025 | 2024 | 2023 |
|---|---|---|---|
| Free Cash Flow Yield | 23.88% | 17.11% | 13.71% |
| Earnings Yield | -15.67% | 14.93% | 8.92% |
| CAPEX to Operating Cash Flow | 41.42% | 56.31% | 55.21% |
| Stock-based Compensation to Revenue | 0.27% | 0.28% | 0.26% |
| Free Cash Flow / Operating Cash Flow Ratio | 58.58% | 43.69% | 44.79% |
While Ford shows commendable free cash leverage, with substantial portions reinvested into the business, profitability challenges could erode these gains without improvements.
Balance Sheet & Leverage Analysis 🏦
Understanding leverage is key to evaluating a firm's financial structure. Ford has demonstrated a high debt-to-equity and high leverage ratio, signaling potential balance sheet stress but manageable credit conditions.
| Metric | 2025 | 2024 | 2023 |
|---|---|---|---|
| Debt-to-Equity | 4.66 | 3.59 | 3.53 |
| Debt-to-Assets | 57.95% | 56.40% | 55.29% |
| Debt-to-Capital | 82.34% | 78.20% | 77.93% |
| Net Debt to EBITDA | 16.91 | 12.58 | 10.61 |
| Current Ratio | 1.07 | 0 | 0 |
| Quick Ratio | 0.94 | 1.02 | 1.04 |
| Financial Leverage | 8.04 | 6.36 | 6.39 |
Despite aggressive leverage, liquidity metrics reflect adequate short-term funding ability, stressing vigilance in debt-heavy contexts.
Fundamental Strength & Profitability 🏆
Evaluating profitability through fundamental metrics offers insights into Ford’s operational health. The negative profit margins in 2025 provide a cautionary note but are offset by efforts to drive efficiency improvements.
| Metric | 2025 | 2024 | 2023 |
|---|---|---|---|
| Return on Equity | -22.76% | 13.11% | 10.16% |
| Return on Assets | -2.83% | 2.06% | 1.59% |
| Net Profit Margin | -4.37% | 3.18% | 2.47% |
| EBIT Margin | 1.35% | 2.75% | 3.05% |
| EBITDA Margin | 4.55% | 5.93% | 6.75% |
| Gross Profit Margin | 12.18% | 12.65% | 13.80% |
| Research & Development to Revenue | 5.02% | 4.32% | 4.65% |
The disparity between fundamental metrics over recent years encapsulates operational challenges faced by Ford, yet its commitment to reinvestment bodes well for long-term strategic growth.
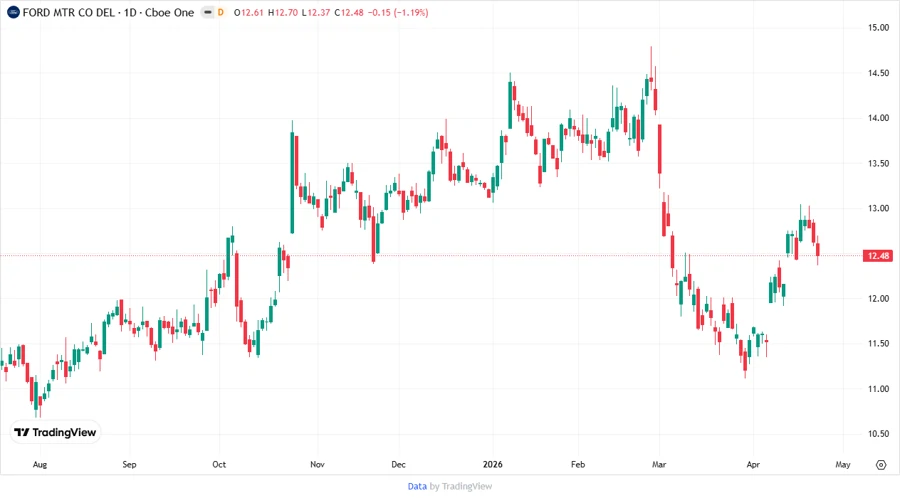
Price Development 📉
Dividend Scoring System ✅
| Category | Score | Score Bar |
|---|---|---|
| Dividend Yield | 3 | |
| Dividend Stability | 2 | |
| Dividend Growth | 2 | |
| Payout Ratio | 3 | |
| Financial Stability | 2 | |
| Dividend Continuity | 3 | |
| Cashflow Coverage | 4 | |
| Balance Sheet Quality | 2 |
Total Score: 21/40
Rating 🏆
Overall, Ford Motor Company's dividend investment profile shows areas of strength in cash flow coverage and yield, but is tempered by the challenges of financial leverage and balance sheet structure. Its commitment to reinvestment is promising; however, the cautious investor should remain vigilant of earnings volatility. Current economic conditions and market responses should be taken into account, with a moderate recommendation for income-oriented portfolios.
Smart Data Insight
Master the Perfect Entry & Exit for this Stock
Don't leave your profits to chance. Historically, this stock follows specific seasonal patterns that institutional traders use to maximize returns.
- ✅ Identify the "Golden Buying Window"
- ✅ Avoid high-risk correction cycles
- ✅ Backtested data from the last 20+ years