
April 09, 2026 a 11:31 am

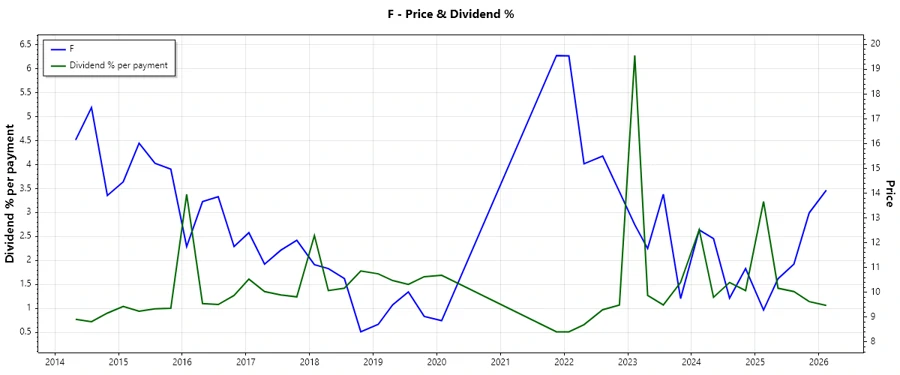


F: Dividend Analysis - Ford Motor Company
The Ford Motor Company offers an intriguing dividend profile with a yielding of 4.25%. However, the negative EPS-based payout ratio indicates potential sustainability issues. Despite this, Ford's long-standing history of 22 years of dividend distribution speaks to its commitment to shareholders. The company's ability to maintain dividends through varying economic conditions reflects resilience, though careful monitoring of financials is advised due to recent figures.
📊 Overview
| Attribute | Details |
|---|---|
| Sector | Automotive |
| Dividend yield | 4.25 % |
| Current dividend per share | 0.75 USD |
| Dividend history | 22 years |
| Last cut or suspension | None |
🗣️ Dividend History
Ford has a considerable track record of dividend payments, indicating reliability in delivering shareholder returns. Examining its history offers insights into its payout capacity and policy, crucial for investors seeking steady income streams.
| Year | Dividend per share (USD) |
|---|---|
| 2026 | 0.15 |
| 2025 | 0.75 |
| 2024 | 0.78 |
| 2023 | 1.25 |
| 2022 | 0.50 |
📈 Dividend Growth
Understanding Ford's dividend growth is crucial for projecting future performance. Consistent increases often signal a company's financial health and shareholder value commitment.
| Time | Growth |
|---|---|
| 3 years | 14.47 % |
| 5 years | 37.97 % |
The average dividend growth is 37.97 % over 5 years. This shows moderate but steady dividend growth.
⚠️ Payout Ratio
Payout ratios help gauge the sustainability of dividends by comparing payouts to earnings and cash flows. Concerns arise when these ratios are high or negative, as they could indicate challenges in maintaining payouts.
| Key figure | Ratio |
|---|---|
| EPS-based | -36.53 % |
| Free cash flow-based | 23.61 % |
The EPS-based payout ratio at -36.53 % suggests profitability issues impacting dividend stability, while a 23.61 % FCF payout indicates dividends are comfortably covered by cash flows.
Cashflow & Capital Efficiency
Studying cash flow and capital efficiency offers a lens into a company's financial health, operational efficiency, and ability to fund dividends internally.
| Year | 2025 | 2024 | 2023 |
|---|---|---|---|
| Free Cash Flow Yield | 23.88% | 17.11% | 13.71% |
| Earnings Yield | -15.67% | 14.93% | 8.92% |
| CAPEX/Operating Cash Flow | 41.42% | 56.31% | 55.21% |
| Stock Compensation/Revenue | 0.27% | 0.28% | 0.26% |
| Free Cash Flow/Operating Cash Flow | 58.58% | 43.69% | 44.79% |
Relatively consistent free cash flow metrics suggest moderate stability. The efficiency in converting operating cash flows to free cash flow indicates some capacity for reinvestment and returns.
Balance Sheet & Leverage Analysis
Analyzing leverage and liquidity metrics provides insight into a company's financial stability and risk levels related to debt usage.
| Year | 2025 | 2024 | 2023 |
|---|---|---|---|
| Debt-to-Equity | 466.1% | 358.8% | 353.3% |
| Debt-to-Assets | 57.95% | 56.40% | 55.29% |
| Debt-to-Capital | 82.34% | 78.20% | 77.94% |
| Net Debt to EBITDA | 19.68 | 12.58 | 10.61 |
| Current Ratio | 1.07 | 1.16 | 1.20 |
| Quick Ratio | 0.94 | 1.02 | 1.04 |
| Financial Leverage | 8.04 | 6.36 | 6.39 |
The elevated debt levels and leverage ratios underscore financial risk, hinting at heavy reliance on borrowed capital. Nevertheless, satisfactory liquidity ratios offer some mitigation against immediate solvency concerns.
📉 Fundamental Strength & Profitability
Profitability and fundamental strength often correlate with a company's ability to maintain dividends and attract investors.
| Year | 2025 | 2024 | 2023 |
|---|---|---|---|
| Return on Equity | -22.76% | 13.11% | 10.16% |
| Return on Assets | -2.83% | 2.06% | 1.59% |
| Margins: Net | -4.37% | 3.18% | 2.47% |
| EBIT | 1.35% | 2.75% | 3.05% |
| EBITDA | 4.55% | 5.93% | 6.75% |
| Gross | 12.18% | 12.65% | 13.80% |
| Research & Development to Revenue | 5.02% | 4.32% | 4.65% |
The substantial variations in profitability metrics reflect instability, but there are pockets of strength, such as reasonable gross and EBITDA margins, indicating potential for recovery with strategic management.
Price Development
✅ Dividend Scoring System
| Category | Score | Score Bar |
|---|---|---|
| Dividend yield | 4 | |
| Dividend Stability | 3 | |
| Dividend growth | 3 | |
| Payout ratio | 2 | |
| Financial stability | 2 | |
| Dividend continuity | 4 | |
| Cashflow Coverage | 3 | |
| Balance Sheet Quality | 2 |
Total Score: 23 out of 40
🗣️ Rating
In summary, the Ford Motor Company's dividend policy appears to reflect a suitable balance between returns and growth prospects. Nevertheless, investors should keep a close watch on financial headwinds requiring strategic improvements. While dividends have shown resilience, the pressure on earnings presents both challenges and opportunities. The overall rating for Ford remains cautiously optimistic, given its mixed financial picture and historical recompenses.
Smart Data Insight
Master the Perfect Entry & Exit for this Stock
Don't leave your profits to chance. Historically, this stock follows specific seasonal patterns that institutional traders use to maximize returns.
- ✅ Identify the "Golden Buying Window"
- ✅ Avoid high-risk correction cycles
- ✅ Backtested data from the last 20+ years