February 12, 2026 a 03:31 pm

📊 Dividend Analysis - Ford Motor Company
Ford Motor Company presents a robust dividend profile, which is primarily characterized by a stable dividend history and historically attractive yield percentage. Despite some recent financial challenges, the company's commitment to maintaining dividends underscores its shareholder value approach. The analysis below delves into the company's dividend sustainability and growth potential.
🗣️ Overview
Ford Motor Company operates in the automotive sector, renowned for delivering dividends for over two decades. The firm's current dividend yield stands at 4.33%, complemented by a dividend per share of $0.75. Despite these strong points, investors should be aware of the absence of recent dividend cuts or suspensions.
| Indicator | Details |
|---|---|
| Sector | Automotive |
| Dividend Yield | 4.33% |
| Current Dividend Per Share | 0.75 USD |
| Dividend History | 22 years |
| Last Cut or Suspension | None |
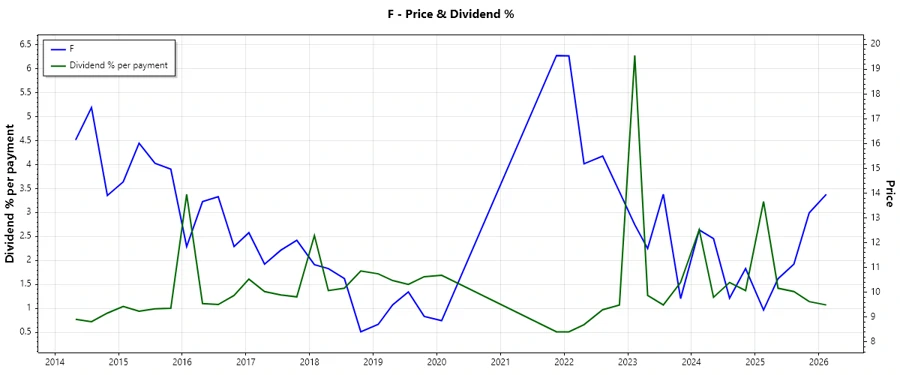
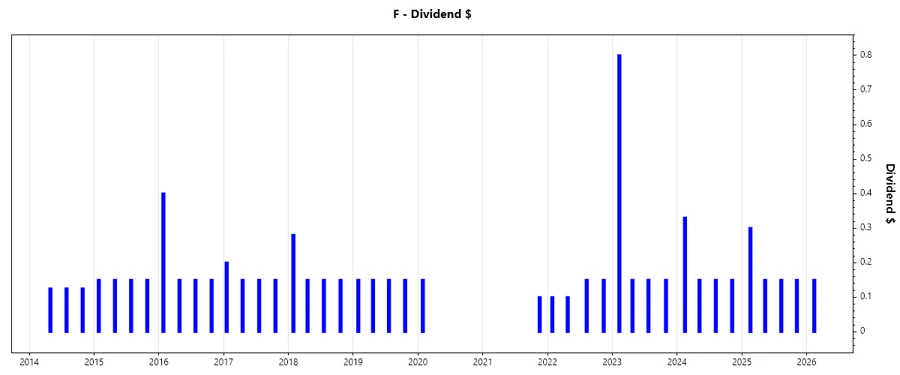
📉 Dividend History
The company has a stable and lengthy dividend history, which signals its dedication to rewarding shareholders. This consistency instills confidence among investors regarding potential returns and corporate reliability.
This chart visualizes the steady dividend distribution over the years.
| Year | Dividend Per Share (USD) |
|---|---|
| 2026 | 0.15 |
| 2025 | 0.75 |
| 2024 | 0.78 |
| 2023 | 1.25 |
| 2022 | 0.50 |
📈 Dividend Growth
Dividend growth is a critical factor that illustrates the potential for income enhancement over time. Over the last 3 years, the dividend growth has been 14.47%, while the 5-year growth rate stands at 37.97%. This indicates a healthy upward trend in dividend distributions.
| Time | Growth |
|---|---|
| 3 years | 14.47% |
| 5 years | 37.97% |
The average dividend growth is 37.97% over five years, showcasing moderate but steady dividend growth, which is positive for income-focused investors.
This diagram emphasizes the growth trend over recent years.
✅ Payout Ratio
Understanding the payout ratio is crucial as it illustrates how much of the profits are distributed as dividends. An EPS-based payout ratio of -36.53% signals a potential risk due to negative earnings, whereas a FCF-based ratio of 24.71% shows sustainability in dividend payments.
| Key Figure | Ratio |
|---|---|
| EPS-based | -36.53% |
| Free cash flow-based | 24.71% |
While the negative EPS-based ratio suggests a challenging earnings environment, the relatively low FCF-based ratio indicates that dividends are supported by cash flow efficiency.
📊 Cashflow & Capital Efficiency
Cashflow analysis helps ascertain the company’s operational efficiency and capacity to fund future dividends. Key ratios such as Free Cash Flow Yield and CAPEX to Operating Cash Flow play a pivotal role in these evaluations.
| Metric | 2025 | 2024 | 2023 |
|---|---|---|---|
| Free Cash Flow Yield | 40.77% | 17.11% | 13.71% |
| Earnings Yield | -15.67% | 14.93% | 8.92% |
| CAPEX to Operating Cash Flow | 41.76% | 56.31% | 55.21% |
| Stock-based Compensation to Revenue | 0.27% | 0.28% | 0.26% |
| Free Cash Flow / Operating Cash Flow Ratio | 100% | 43.69% | 44.79% |
The FCF yield is robust, suggesting good cashflow stability, although the current CAPEX allocations might require monitoring to ensure continuous dividend capacity.
⚖️ Balance Sheet & Leverage Analysis
Examine key balance sheet metrics to understand the financial leverage and liquidity of the firm. This analysis provides insights into the company’s capacity to sustain operations and downturn resilience.
| Metric | 2025 | 2024 | 2023 |
|---|---|---|---|
| Debt-to-Equity | 4.54 | 3.59 | 3.53 |
| Debt-to-Assets | 56.49% | 56.40% | 55.29% |
| Debt-to-Capital | 81.96% | 78.20% | 77.94% |
| Net Debt to EBITDA | -15.27 | 9.69 | 10.69 |
| Current Ratio | 1.12 | 1.16 | 1.20 |
| Quick Ratio | 0.94 | 1.02 | 1.04 |
| Financial Leverage | 8.04 | 6.36 | 6.39 |
High leverage levels reflect strong reliance on debt financing, potentially affecting Ford’s financial stability during economic downturns.
📈 Fundamental Strength & Profitability
This assessment evaluates profitability margins and returns that indicate operational competence and growth potential, which are vital for forecasting future dividend payouts.
| Metric | 2025 | 2024 | 2023 |
|---|---|---|---|
| Return on Equity | -22.76% | 13.11% | 10.16% |
| Return on Assets | -2.83% | 2.06% | 1.59% |
| Margins: Net | -4.37% | 3.18% | 2.47% |
| EBIT | 0% | 4.52% | 3.00% |
| EBITDA | -4.90% | 7.70% | 6.70% |
| Gross | 0% | 8.38% | 9.17% |
| Research & Development to Revenue | 0% | 0% | 0% |
Despite negative returns and margins in 2025, the improvements seen in 2024 and 2023 highlight potential recovery and a stronger foundation for future profitability and dividend sustainability.
📉 Price Development
This chart showcases Ford's stock price trends over the past years.
📊 Dividend Scoring System
| Criteria | Score | Score Bar |
|---|---|---|
| Dividend Yield | 4 | |
| Dividend Stability | 4 | |
| Dividend Growth | 3 | |
| Payout Ratio | 2 | |
| Financial Stability | 2 | |
| Dividend Continuity | 4 | |
| Cashflow Coverage | 3 | |
| Balance Sheet Quality | 2 |
Overall Score: 24 out of 40
🗣️ Rating
Ford Motor Company offers a compelling dividend profile with a stable yield and growth history. However, challenges in financial stability and profitability emphasize a cautious approach. Investors looking for income with moderate risk may find Ford suitable, but must remain vigilant about potential volatility and improvements in operational performance.
Smart Data Insight
Master the Perfect Entry & Exit for this Stock
Don't leave your profits to chance. Historically, this stock follows specific seasonal patterns that institutional traders use to maximize returns.
- ✅ Identify the "Golden Buying Window"
- ✅ Avoid high-risk correction cycles
- ✅ Backtested data from the last 20+ years