December 03, 2025 a 03:31 pm


📊 Dividend Analysis - Ford Motor Company
Ford Motor Company, a stalwart in the automotive industry, presents a consistent dividend policy characterized by a notable dividend yield. With over two decades of unbroken dividend history, investors find a good blend of stability and return. However, prospective investors should also consider the company's debt load and its potential impact on future dividends.
🗣️ Overview
A sector-specific glance shows that Ford thrives in the Automobile realm. Consistent divdend yields reassure risk-averse investors seeking income alongside growth.
| Metric | Details |
|---|---|
| Sector | Automobile |
| Dividend yield | 5.68% |
| Current dividend per share | 0.78 USD |
| Dividend history | 21 years |
| Last cut or suspension | None |
📈 Dividend History
The importance of the historical dividend pattern lies in its ability to offer insights into the company's commitment to returning value to shareholders. A strong history often suggests resilient business operations.
| Year | Dividend per Share (USD) |
|---|---|
| 2025 | 0.75 |
| 2024 | 0.78 |
| 2023 | 1.25 |
| 2022 | 0.50 |
| 2021 | 0.10 |
📈 Dividend Growth
Growth trends in dividends reveal the company's ability to enhance shareholder returns over time. A sustained increase indicates healthy financial growth and capacity to maintain payout ratios.
| Time | Growth |
|---|---|
| 3 years | 0.98% |
| 5 years | 0.05% |
The average dividend growth is 0.05% over 5 years. This shows moderate but steady dividend growth.
📉 Payout Ratio
Payout ratios indicate the proportion of earnings and cash flows that are distributed as dividends. Low ratios suggest the potential for growth or increased distributions.
| Key figure | Ratio |
|---|---|
| EPS-based | 66.34% |
| Free cash flow-based | 25.78% |
The EPS payout ratio at 66.34% is moderate, allowing room for reinvestment. The FCF payout ratio is healthy at 25.78%, illustrating strong liquidity.
💰 Cashflow & Capital Efficiency
Cash flow analysis provides insights into the liquidity and operational efficiency, indicating a company's ability to sustain dividends and invest for growth.
Below are historical trends showcasing fundamental cash flow and capital strategies:
| Year | 2024 | 2023 | 2022 |
|---|---|---|---|
| Free Cash Flow Yield | 17.11% | 13.71% | -0.03% |
| Earnings Yield | 14.93% | 8.92% | -4.24% |
| CAPEX to Operating Cash Flow | 56.31% | 55.21% | 100.19% |
| Stock-based Compensation to Revenue | 0.28% | 0.26% | 0.21% |
| Free Cash Flow / Operating Cash Flow Ratio | 43.69% | 44.79% | -0.19% |
Ford's efficient capital allocation is evident through its free cash flow generation and disciplined CAPEX positioning, vital for resilient operational support.
📊 Balance Sheet & Leverage Analysis
A robust balance sheet with manageable leverage ratios ensures business continuity and protects dividend policies. Ford's capacity to manage debt will reflect in how future dividends can be maintained.
| Year | 2024 | 2023 | 2022 |
|---|---|---|---|
| Debt-to-Equity | 3.59 | 3.53 | 3.25 |
| Debt-to-Assets | 0.56 | 0.55 | 0.55 |
| Debt-to-Capital | 0.78 | 0.78 | 0.76 |
| Net Debt to EBITDA | 9.69 | 10.69 | 24.23 |
| Current Ratio | 1.16 | 1.20 | 1.20 |
| Quick Ratio | 1.02 | 1.04 | 1.06 |
| Financial Leverage | 6.36 | 6.39 | 5.92 |
High leverage is indicative of potential risk, yet the ability to manage short-term liabilities remains critical in sustaining operational stability.
📊 Fundamental Strength & Profitability
Key financial ratios such as ROE and margins gauge the effectiveness of how well Ford deploys capital to generate profit and value for investors.
| Year | 2024 | 2023 | 2022 |
|---|---|---|---|
| Return on Equity | 13.11% | 10.16% | -4.58% |
| Return on Assets | 2.06% | 1.59% | -0.77% |
| Net Margin | 3.18% | 2.47% | -1.25% |
| EBIT Margin | 4.52% | 3.00% | -1.10% |
| EBITDA Margin | 7.70% | 6.70% | 3.01% |
| Gross Margin | 8.38% | 9.17% | 10.86% |
| Research & Development to Revenue | 0% | 0% | 0% |
Profitability is comparatively moderate, considering both ROE and margins, depicting good control over costs and optimizing operating performance.
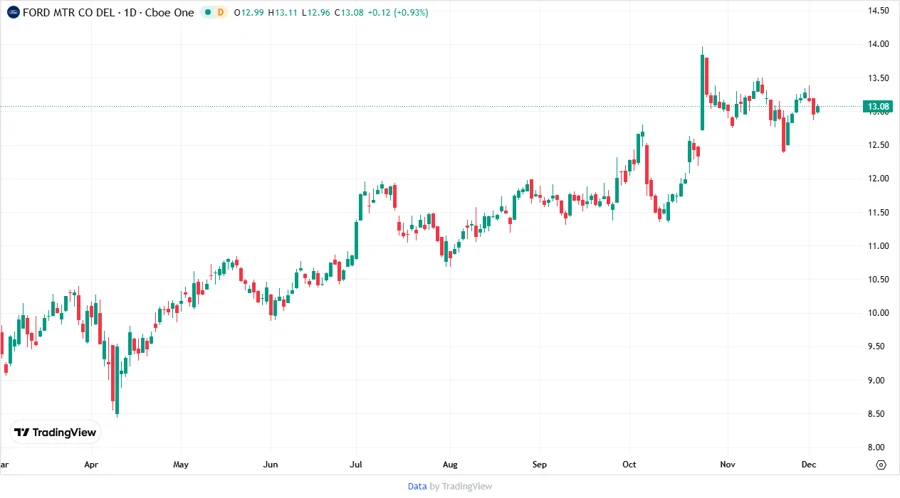
📉 Price Development
✅ Dividend Scoring System
| Criteria | Score | Visualization |
|---|---|---|
| Dividend yield | 5 | |
| Dividend Stability | 4 | |
| Dividend growth | 2 | |
| Payout ratio | 3 | |
| Financial stability | 3 | |
| Dividend continuity | 4 | |
| Cashflow Coverage | 3 | |
| Balance Sheet Quality | 3 |
Total Score: 27 out of 40
🗣️ Rating
The Ford Motor Company's dividend profile scores well on yield and stability, making it attractive for income-focused investors. However, ongoing financial leverage and modest growth prospects suggest a cautious approach. As such, Ford receives a hold rating, dependent on an investor's appetite for risk and yield.