July 29, 2025 a 07:46 am


📊 Dividend Analysis - Ford Motor Company
Ford Motor Company offers a robust dividend profile with a competitive yield. The company's dividend history showcases a commitment to maintaining shareholder value, while the dividend growth remains steady albeit moderate. This analysis will explore key metrics that highlight Ford's financial health and assess its potential as a dividend investment.
🗣️ Overview
Ford Motor Company, a leader in the Automotive sector, is known for its significant dividend yield, which currently stands at 7.11%. With a current dividend per share of 0.78 USD, Ford has maintained a dividend payment history for 21 years without recent suspensions, underscoring its financial resilience and dedication to returning capital to shareholders.
| Metric | Value |
|---|---|
| Sector | Automotive |
| Dividend Yield | 7.11% |
| Current Dividend per Share | 0.78 USD |
| Dividend History | 21 years |
| Last Cut or Suspension | None |
📈 Dividend History
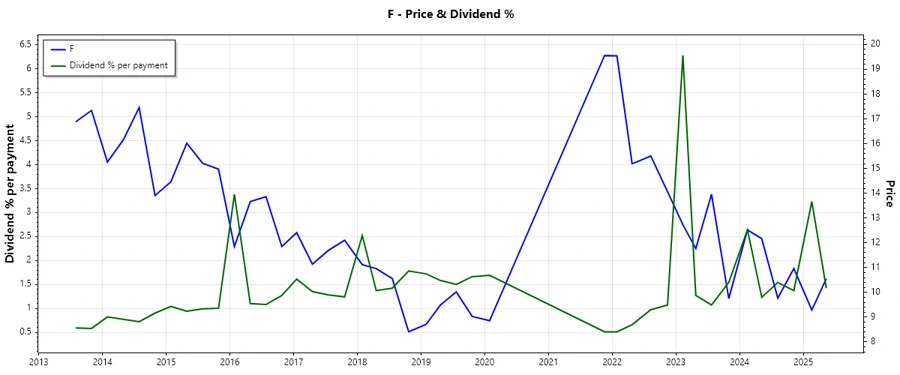
Ford has demonstrated consistent dividend payouts, reflecting its stability and potential for income generation. This consistency is crucial for investors seeking reliable returns. Historically, Ford's dividends have showcased regularity, even though they fluctuated in size to adapt to market conditions.
| Year | Dividend per Share (USD) |
|---|---|
| 2025 | 0.45 |
| 2024 | 0.78 |
| 2023 | 1.25 |
| 2022 | 0.50 |
| 2021 | 0.10 |
🌱 Dividend Growth
The growth of Ford's dividends over the past 3 and 5 years indicates slight improvement. Tracking dividend growth helps in understanding a company's profit distribution growth potential.
| Time | Growth |
|---|---|
| 3 years | 0.98% |
| 5 years | 5.39% |
The average dividend growth is 5.39% over 5 years, indicating moderate but steady dividend growth.
⚙️ Payout Ratio
A company's payout ratios are pivotal in assessing dividend sustainability. High payout ratios may signal potential payment risks, while low ratios indicate enough cushion to absorb earnings volatility.
| Key Figure | Ratio |
|---|---|
| EPS-based | 61.98% |
| Free Cash Flow-based | 32.89% |
The EPS payout ratio of 61.98% is manageable, suggesting that Ford retains sufficient earnings for reinvestment. The FCF payout ratio of 32.89% further underscores its ability to cover dividends from operating cash flow effectively.
📊 Cashflow & Capital Efficiency
Efficient cash flow management and capital use are critical indicators of a company’s ability to sustain and grow dividends. This section highlights these metrics over recent fiscal years.
| Year | 2024 | 2023 | 2022 |
|---|---|---|---|
| Free Cash Flow Yield | 17.11% | 13.71% | -0.03% |
| Earnings Yield | 14.93% | 8.92% | -4.61% |
| CAPEX/Operating Cash Flow | 56.31% | 55.21% | 100.19% |
| Stock-based Compensation/Revenue | 0.28% | 0.26% | 0.21% |
| FCF/OBCF Ratio | 43.69% | 44.79% | -0.19% |
The mixed performance on these ratios emphasizes the volatility of Ford's cash flow, yet highlights the company's capacity to fund dividend payments without resorting to borrowing excessively.
🏦 Balance Sheet & Leverage Analysis
Leverage metrics provide insight into Ford's debt-utilization strategy, an important factor for evaluating risk and financial stability.
| Year | 2024 | 2023 | 2022 |
|---|---|---|---|
| Debt-to-Equity | 3.59 | 3.53 | 3.25 |
| Debt-to-Assets | 0.56 | 0.55 | 0.55 |
| Debt-to-Capital | 0.78 | 0.78 | 0.76 |
| Net Debt to EBITDA | 9.70 | 10.68 | 24.35 |
| Current Ratio | 1.16 | 1.20 | 1.20 |
| Quick Ratio | 1.02 | 1.04 | 1.06 |
| Financial Leverage | 6.36 | 6.39 | 5.92 |
Ford's leverage ratios suggest a significant reliance on debt, which can be risky amidst economic downturns. However, its current and quick ratios remain stable, ensuring adequate liquidity to cover near-term obligations.
🥇 Fundamental Strength & Profitability
Profitability ratios like ROE and ROA reflect Ford's operational efficiency, while margins give insight into cost structures and pricing strategies.
| Year | 2024 | 2023 | 2022 |
|---|---|---|---|
| Return on Equity | 13.11% | 10.16% | -4.98% |
| Return on Assets | 2.06% | 1.59% | -0.84% |
| Net Margin | 3.18% | 2.47% | -1.36% |
| EBIT Margin | 4.52% | 3.00% | -1.11% |
| EBITDA Margin | 7.68% | 6.71% | 2.99% |
| Gross Margin | 14.36% | 9.17% | 14.97% |
| R&D/Revenue | 4.32% | 4.65% | 4.93% |
The improvement in profitability metrics reflects Ford's strategic focus on efficiency and cost control, positioning them well against competitive pressures.
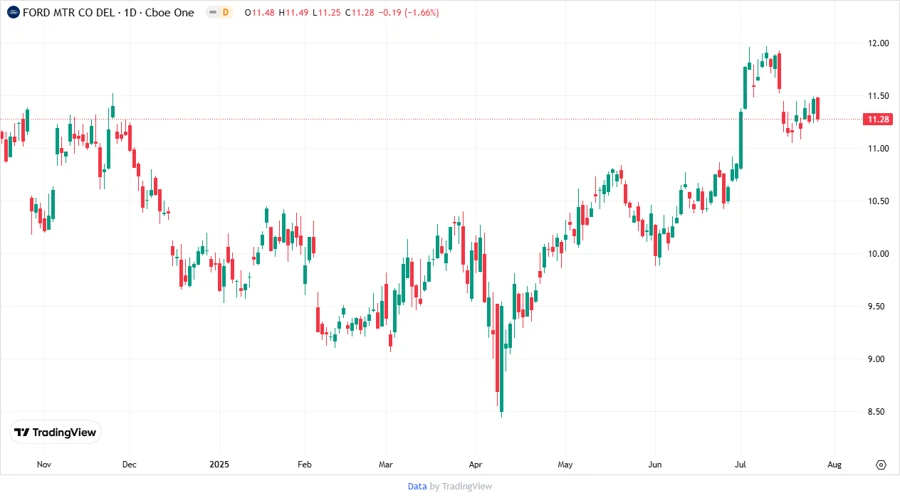
📉 Price Development
✔️ Dividend Scoring System
| Criterion | Score | Score Bar |
|---|---|---|
| Dividend Yield | 4 | |
| Dividend Stability | 3 | |
| Dividend Growth | 2 | |
| Payout Ratio | 3 | |
| Financial Stability | 2 | |
| Dividend Continuity | 4 | |
| Cashflow Coverage | 3 | |
| Balance Sheet Quality | 2 |
Total Score: 23/40
⭐ Rating
Ford Motor Company demonstrates a strong dividend profile with high yields, supported by consistent financial performance and stable cash flow. However, their elevated debt levels warrant cautious monitoring. The total dividend score suggests a moderate buy for dividend-focused investors, contingent on continuous financial stability and strategic risk management.
Smart Data Insight
Master the Perfect Entry & Exit for this Stock
Don't leave your profits to chance. Historically, this stock follows specific seasonal patterns that institutional traders use to maximize returns.
- ✅ Identify the "Golden Buying Window"
- ✅ Avoid high-risk correction cycles
- ✅ Backtested data from the last 20+ years