June 15, 2026 a 03:15 amFortive Corporation Trend and Support & Resistance Analysis Report

FTV: Trend and Support & Resistance Analysis - Fortive Corporation
Fortive Corporation has shown diverse movements in its stock price over the past few months. As a globally recognized industrial technology player, Fortive delivers various specialized solutions across industries. The current technical analysis marks significant trends and pivotal support and resistance zones to guide potential investment decisions. Understanding these metrics is crucial for stakeholders looking at short-term and long-term positions in Fortive's stock.
Trend Analysis
| Date | Closing Price | Trend |
|---|---|---|
| 2026-06-12 | 60.14 | ▲ |
| 2026-06-11 | 59.84 | ▲ |
| 2026-06-10 | 60.06 | ▲ |
| 2026-06-09 | 62.78 | ▲ |
| 2026-06-08 | 61.16 | ▼ |
| 2026-06-05 | 61.28 | ▲ |
| 2026-06-04 | 61.47 | ▲ |
The calculated EMA20 and EMA50 based on available data suggest an upward trend denoted by EMA20 being higher than EMA50. This indicates a positive sentiment among investors and potential upward momentum in the stock price.

Support and Resistance
| Zone | From | To | Direction |
|---|---|---|---|
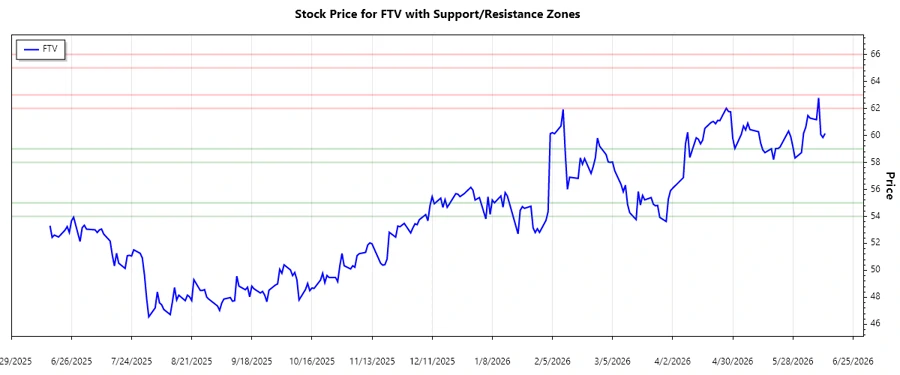
| Support 1 | 58.0 | 59.0 | ▼ |
| Support 2 | 54.0 | 55.0 | ▼ |
| Resistance 1 | 62.0 | 63.0 | ▲ |
| Resistance 2 | 65.0 | 66.0 | ▲ |
The current stock price is close to the upper resistance zone, which could act as a barrier. Breaching this level could signal further upside potential for investor returns.
Conclusion
The Fortive Corporation stock shows a positive trend with prices slightly on the higher side of a major resistance zone. Investors must monitor if the stock manages to breach this zone for potential gains. However, if the stock price fails to break the resistance, it might revert back to the support levels. Thus, maintaining a balanced approach with close monitoring can leverage opportunities derived from the current trend and zone assessments.
Smart Data Insight
Master the Perfect Entry & Exit for this Stock
Don't leave your profits to chance. Historically, this stock follows specific seasonal patterns that institutional traders use to maximize returns.
- ✅ Identify the "Golden Buying Window"
- ✅ Avoid high-risk correction cycles
- ✅ Backtested data from the last 20+ years