August 26, 2025 a 05:15 am

FTV: Fibonacci Analysis - Fortive Corporation
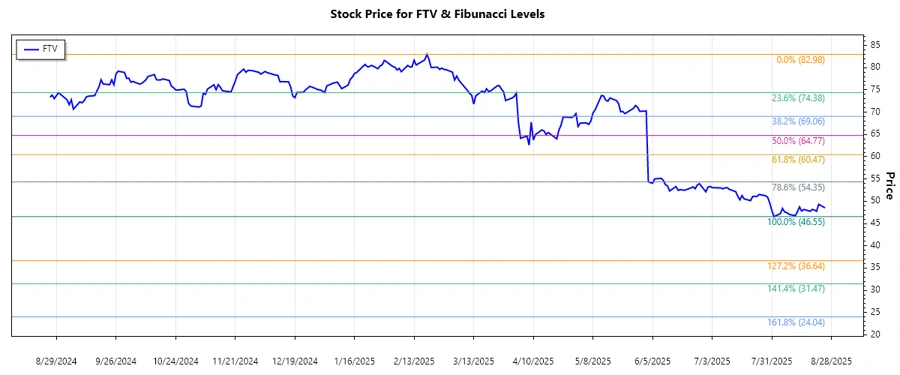
Fortive Corporation operates in various segments, offering a diverse range of advanced technologies and solutions. Recently, the stock has been under a consistent downtrend, reflecting broader market challenges and sector-specific hurdles. However, the diverse business model could provide resilience, potentially capturing upside during market recoveries.
Fibonacci Analysis
| Start Date | End Date | High Price | High Date | Low Price | Low Date |
|---|---|---|---|---|---|
| 2024-12-09 | 2025-08-25 | 82.98 | 2025-02-19 | 46.55 | 2025-08-01 |
| Fibonacci Level | Price Level |
|---|---|
| 0.236 | 58.18 |
| 0.382 | 63.80 |
| 0.5 | 67.77 |
| 0.618 | 71.75 |
| 0.786 | 76.41 |
The current price of 48.51 lies below the 0.236 Fibonacci retracement level, indicating that the stock has not yet entered a significant retracement zone. This suggests ongoing bearish momentum, with potential support levels around the lower Fibonacci levels.
Conclusion
The recent downtrend in Fortive Corporation's stock price highlights concerns over market and sector volatility. Despite these challenges, Fortive's diversified portfolio, encompassing intelligent operating solutions and precision technology, may offer significant long-term growth potential. The stock's current position under its retracement levels indicates that it remains under pressure. Investors might view current prices as a potential buy on dip scenario if broader market trends stabilize. However, caution is recommended until clearer signs of reversal emerge, as continued downside risk could persist in the short term.
Smart Data Insight
Master the Perfect Entry & Exit for this Stock
Don't leave your profits to chance. Historically, this stock follows specific seasonal patterns that institutional traders use to maximize returns.
- ✅ Identify the "Golden Buying Window"
- ✅ Avoid high-risk correction cycles
- ✅ Backtested data from the last 20+ years