
July 17, 2026 a 07:30 am


FTV: Dividend Analysis - Fortive Corporation
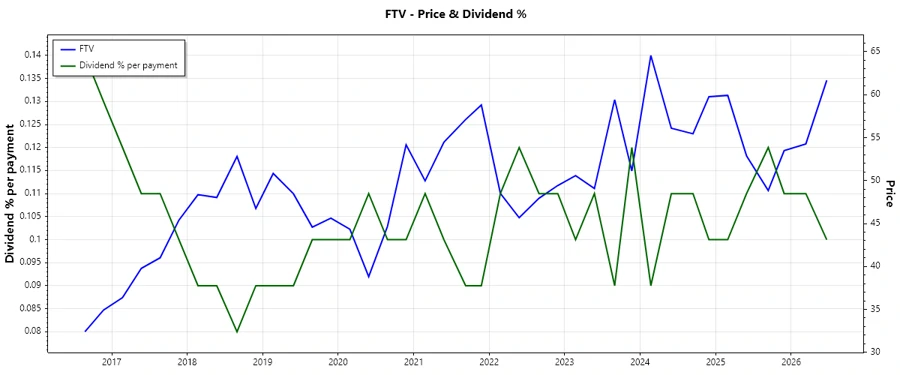
Fortive Corporation displays a moderate dividend yield coupled with a healthy dividend history, reflecting its commitment to rewarding shareholders. The company's stable payout and growth over the years showcase its financial resilience. However, potential investors should weigh these strengths against market dynamics and individual financial objectives.
📊 Overview
Fortive Corporation, a key player in its sector, exhibits a modest dividend yield and a consistent dividend track record, which signals reliability to potential and existing investors.
| Criteria | Details |
|---|---|
| Sector | Sector Data Not Provided |
| Dividend yield | 0.39 % |
| Current dividend per share | 0.2914 USD |
| Dividend history | 11 years |
| Last cut or suspension | None |
🗣️ Dividend History
The dividend history reflects Fortive’s commitment to consistent shareholder returns, which is crucial for assessing future payout sustainability.
| Year | Dividend per Share (USD) |
|---|---|
| 2026 | 0.12 |
| 2025 | 0.2405363 |
| 2024 | 0.2410726 |
| 2023 | 0.21847204 |
| 2022 | 0.21093852 |
📈 Dividend Growth
Dividend growth is essential for evaluating potential value appreciation and inflation hedging. Fortive's growth dynamics over recent years are indicative of its strategic financial planning.
| Time | Growth |
|---|---|
| 3 years | 4.47 % |
| 5 years | 5.39 % |
The average dividend growth is 5.39% over 5 years. This shows moderate but steady dividend growth.
✅ Payout Ratio
Payout ratios offer insights into the proportion of earnings and cash flows dedicated to dividends, critical for assessing payout sustainability.
| Key figure | Ratio |
|---|---|
| EPS-based | 16.59 % |
| Free cash flow-based | 9.15 % |
The EPS payout ratio of 16.59% and FCF payout ratio of 9.15% suggest a conservative approach, ensuring dividend safety and potential for reinvestment.
Cashflow & Capital Efficiency
This analysis sheds light on how Fortive converts revenue into cash flow, a key indicator of operational efficiency and financial health.
| 2023 | 2024 | 2025 | |
|---|---|---|---|
| Free Cash Flow Yield | 6.37% | 7.13% | 5.60% |
| Earnings Yield | 4.43% | 4.22% | 3.32% |
| CAPEX to Operating Cash Flow | 7.96% | 7.89% | 9.75% |
| Stock-based Compensation to Revenue | 1.87% | 1.75% | 2.27% |
| Free Cash Flow / Operating Cash Flow Ratio | 92.04% | 92.11% | 90.30% |
This data highlights Fortive's consistent cash flow generation and prudent capital expenditure strategy, supporting long-term operational efficiency.
Balance Sheet & Leverage Analysis
This section examines Fortive's financial structure, emphasizing its ability to meet obligations and manage leverage responsibly.
| 2023 | 2024 | 2025 | |
|---|---|---|---|
| Debt-to-Equity | 36.92% | 38.05% | 49.68% |
| Debt-to-Assets | 22.53% | 22.78% | 27.31% |
| Debt-to-Capital | 26.97% | 27.56% | 33.19% |
| Net Debt to EBITDA | 1.22 | 1.84 | 2.36 |
| Current Ratio | 2.05 | 1.16 | 0.71 |
| Quick Ratio | 1.75 | 0.91 | 0.58 |
| Financial Leverage | 1.64 | 1.67 | 1.82 |
These metrics suggest Fortive maintains a balanced leverage approach, ensuring financial stability while adequately leveraging debt for growth opportunities.
Fundamental Strength & Profitability
Evaluation of Fortive's ability to generate profits efficiently from its resources, reflecting management's strategic acumen.
| 2023 | 2024 | 2025 | |
|---|---|---|---|
| Return on Equity | 8.39% | 8.17% | 8.98% |
| Return on Assets | 5.12% | 4.89% | 4.93% |
| Net Margin | 14.27% | 13.37% | 11.26% |
| EBIT Margin | 18.37% | 18.01% | 17.00% |
| EBITDA Margin | 25.90% | 26.74% | 23.34% |
| Gross Margin | 59.26% | 59.87% | 60.96% |
| R&D to Revenue | 6.56% | 6.64% | 6.66% |
Fortive's profitability ratios illustrate efficient resource utilization and robust financial fundamentals, underpinning long-term shareholder value creation.
Price Development
Dividend Scoring System
| Category | Score (1-5) | Score Bar |
|---|---|---|
| Dividend yield | 2 | |
| Dividend Stability | 5 | |
| Dividend growth | 4 | |
| Payout ratio | 5 | |
| Financial stability | 4 | |
| Dividend continuity | 5 | |
| Cashflow Coverage | 4 | |
| Balance Sheet Quality | 3 |
Total Score: 32/40
Rating
Fortive Corporation's financial and dividend performance showcases a balance of stability and growth potential. While its dividend yield might appear modest, the robust growth, strong payout ratios, and financial stability underpin its attractiveness as a long-term investment. Investors seeking reliable income with growth prospects might find Fortive a desirable addition to their portfolio.
Smart Data Insight
Master the Perfect Entry & Exit for this Stock
Don't leave your profits to chance. Historically, this stock follows specific seasonal patterns that institutional traders use to maximize returns.
- ✅ Identify the "Golden Buying Window"
- ✅ Avoid high-risk correction cycles
- ✅ Backtested data from the last 20+ years