
April 28, 2026 a 02:47 am

FTV: Dividend Analysis - Fortive Corporation
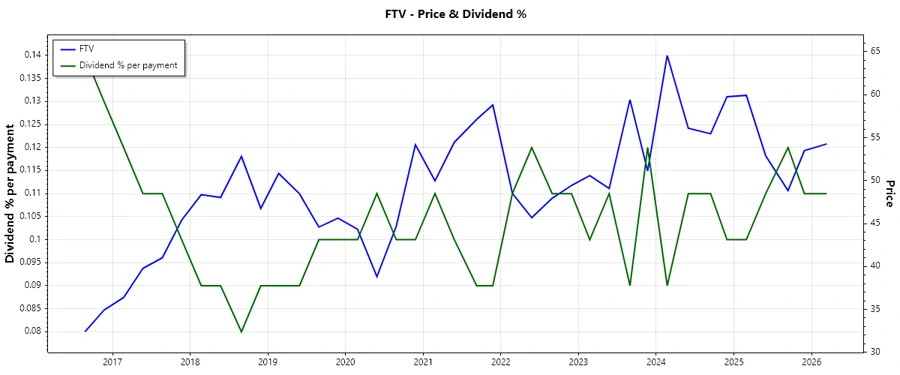
Fortive Corporation shows a steady dividend yield with a moderate growth history and low dividend payout ratios. The company's financial stability and cash flow coverage support its dividend commitments. Although the yield is relatively low, the overall stability of Fortive's dividend can serve as a reliable income source for long-term investors.
📊 Overview
Fortive Corporation has been distributing dividends for 11 years, demonstrating reliability, although its 0.44% yield suggests a focus on growth and reinvestment over high immediate returns. With a minimal history of dividend cuts, it presents a dependably growing investment opportunity.
| Metric | Value |
|---|---|
| Sector | - |
| Dividend yield | 0.44 % |
| Current dividend per share | 0.29 USD |
| Dividend history | 11 years |
| Last cut or suspension | None |
🗣️ Dividend History
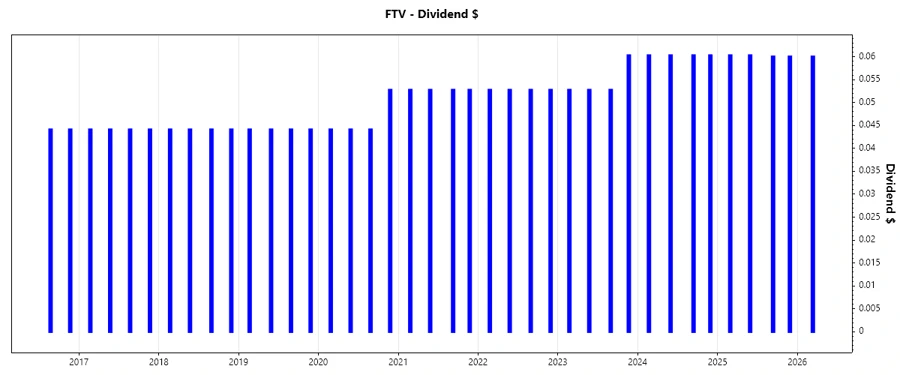
Tracking the dividend payments over the years is crucial to understanding the sustainability and growth of the dividend policy. Fortive's consistent payments indicate solid financial management even during economically turbulent times.
| Year | Dividend per Share (USD) |
|---|---|
| 2026 | 0.06 |
| 2025 | 0.2405 |
| 2024 | 0.2411 |
| 2023 | 0.2185 |
| 2022 | 0.2109 |
📈 Dividend Growth
Examination of dividend growth presents insight into future earnings potential and shareholder value. Fortive's growth rates over 3 and 5 years display faith from management in the company's earning power.
| Time | Growth |
|---|---|
| 3 years | 4.47 % |
| 5 years | 5.39 % |
The average dividend growth is 5.39 % over 5 years. This shows moderate but steady dividend growth.
📉 Payout Ratio
Payout ratios are vital in analyzing the sustainability of dividend payments. Fortive's low payout ratios indicate a strong ability to cover dividend payments from earnings and free cash flow.
| Key figure | Ratio |
|---|---|
| EPS-based | 15.92 % |
| Free cash flow-based | 9.17 % |
The low EPS payout ratio of 15.92% and FCF payout ratio of 9.17% suggest Fortive's payouts are sustainable and leave room for further increases.
✅ Cashflow & Capital Efficiency
These metrics indicate the financial flexibility and the efficiency of capital allocation. Fortive's performance in these areas highlights effective management and the potential for future growth or returns to shareholders.
| Year | 2025 | 2024 | 2023 |
|---|---|---|---|
| Free Cash Flow Yield | 5.60% | 7.13% | 6.37% |
| Earnings Yield | 3.32% | 4.22% | 4.43% |
| CAPEX to Operating Cash Flow | 9.70% | 7.89% | 7.96% |
| Stock-based Compensation to Revenue | 2.27% | 1.75% | 1.87% |
| Free Cash Flow / Operating Cash Flow Ratio | 90.30% | 92.11% | 92.04% |
Fortive's cash flow metrics illustrate robust financial health, supporting sustained investments and dividend distributions.
📊 Balance Sheet & Leverage Analysis
Analyzing balance sheet and leverage ratios provides insights into Fortive's financial stability and risk profile. A balanced approach to leveraging indicates cautious financial planning and capacity for enduring adverse conditions.
| Year | 2025 | 2024 | 2023 |
|---|---|---|---|
| Debt-to-Equity | 0.50 | 0.38 | 0.37 |
| Debt-to-Assets | 0.27 | 0.23 | 0.23 |
| Debt-to-Capital | 0.33 | 0.28 | 0.27 |
| Net Debt to EBITDA | 2.36 | 1.84 | 1.22 |
| Current Ratio | 0.71 | 1.16 | 2.05 |
| Quick Ratio | 0.58 | 0.91 | 1.75 |
| Financial Leverage | 1.82 | 1.67 | 1.64 |
Strong liquidity ratios coupled with manageable debt levels suggest Fortive’s prudent leverage strategy and stable financial position.
📈 Fundamental Strength & Profitability
A robust profitability profile reflects Fortive’s capability to generate earnings efficiently and sustain future growth. Healthy margins and returns signify a competitive edge in its sector.
| Year | 2025 | 2024 | 2023 |
|---|---|---|---|
| Return on Equity | 8.98% | 8.17% | 8.39% |
| Return on Assets | 4.93% | 4.89% | 5.12% |
| Net Profit Margin | 11.26% | 13.37% | 14.27% |
| EBIT Margin | 17.00% | 18.01% | 18.37% |
| EBITDA Margin | 23.34% | 26.74% | 25.90% |
| Gross Margin | 60.96% | 59.87% | 59.26% |
| R&D to Revenue | 6.66% | 6.64% | 6.56% |
Fortive’s profitability and efficiency indexes convey a well-positioned enterprise with effective cost controls and growth strategies.
🔄 Price Development
🔢 Dividend Scoring System
| Criteria | Score | Score Bar |
|---|---|---|
| Dividend yield | 2 | |
| Dividend Stability | 4 | |
| Dividend growth | 3 | |
| Payout ratio | 5 | |
| Financial stability | 4 | |
| Dividend continuity | 5 | |
| Cashflow Coverage | 4 | |
| Balance Sheet Quality | 4 |
Score: 31/40
🏆 Rating
In conclusion, Fortive Corporation presents a stable yet moderately yielding dividend profile. Given its financial health and strong past performance, the stock is suitable for risk-averse investors prioritizing dividend safety over high yield. The strong cash flow and consistent dividend history make Fortive an appealing dividend candidate with room for potential growth in payouts.
Smart Data Insight
Master the Perfect Entry & Exit for this Stock
Don't leave your profits to chance. Historically, this stock follows specific seasonal patterns that institutional traders use to maximize returns.
- ✅ Identify the "Golden Buying Window"
- ✅ Avoid high-risk correction cycles
- ✅ Backtested data from the last 20+ years