October 30, 2025 a 03:31 pm
FTV: Dividend Analysis - Fortive Corporation
Fortive Corporation exhibits a stable, albeit modest dividend yield, complemented by a consistent history of dividend payouts over the past decade. Its commitment to maintaining and gradually growing its dividends underscores the company’s focus on long-term shareholder value. The dividend structure is further supported by a healthy payout ratio indicating sustainability and potential for growth.
📊 Overview
Fortive Corporation operates within a sector focused on sustainable dividend payouts. With a current dividend yield of 0.49%, shareholders can expect regular income, though the yield is modest by industry standards. The firm has consistently paid dividends over the past 10 years without suspensions, which speaks to its financial discipline and commitment to shareholder returns.
| Factor | Details |
|---|---|
| Sector | Industrial |
| Dividend yield | 0.49% |
| Current dividend per share | 0.318 USD |
| Dividend history | 10 years |
| Last cut or suspension | None |
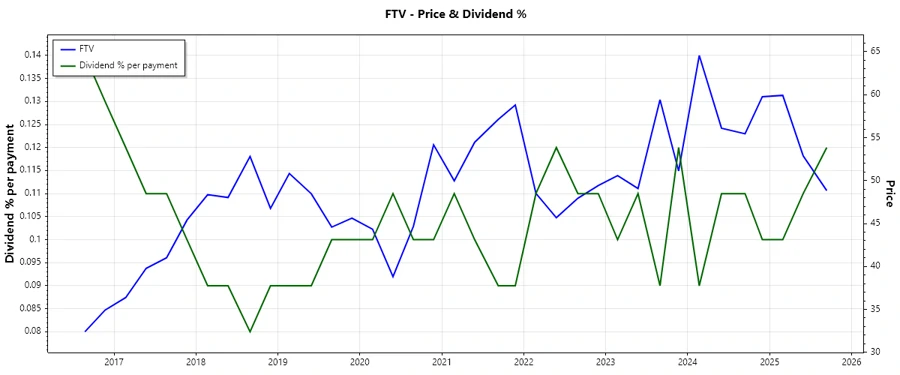
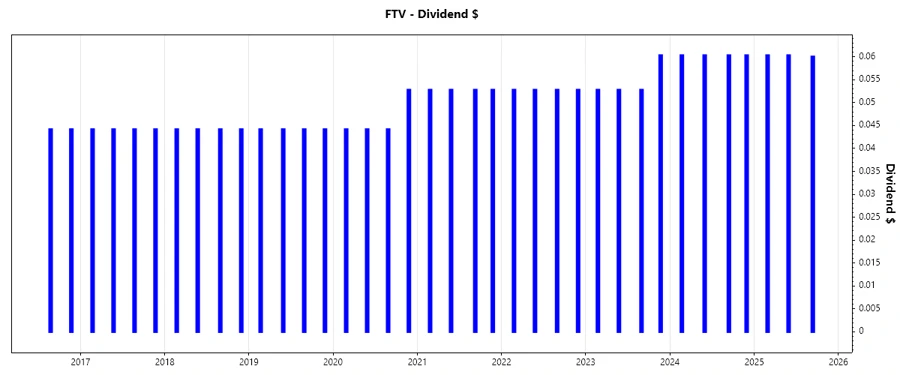
📈 Dividend History
The historical data of Fortive's dividends demonstrates reliability and consistency, which is integral to long-term investment strategies. Dividends have shown resilience even through economic cycles, reinforcing confidence in ongoing payouts.
| Year | Dividend per Share (USD) |
|---|---|
| 2025 | 0.181 |
| 2024 | 0.241 |
| 2023 | 0.219 |
| 2022 | 0.211 |
| 2021 | 0.211 |
🗣️ Dividend Growth
Dividend growth reflects a company's ability to increase payouts, indicating robust financial health and growing profits. Fortive's dividend growth over 3 and 5 years suggests a gradual increase, which is crucial for maintaining purchasing power and yielding inflation-protected income.
| Time | Growth |
|---|---|
| 3 years | 4.55% |
| 5 years | 6.43% |
The average dividend growth is 6.43% over 5 years. This shows moderate but steady dividend growth.
⚠️ Payout Ratio
The payout ratio indicates the proportion of earnings paid out as dividends. Lower percentages suggest room for dividend growth and better resilience during downturns. Fortive's payout ratios indicate a conservative approach, with significant room to increase payouts if earnings rise.
| Key Figure | Ratio |
|---|---|
| EPS-based | 17.49% |
| Free Cash Flow-based | 9.96% |
With an EPS-based payout at 17.49% and FCF-based at 9.96%, Fortive is in a strong position to sustain and potentially increase its dividends.
✅ Cashflow & Capital Efficiency
Healthy cash flow and efficient capital usage support consistent dividend payments. An analysis of Fortive's cash flow against its operating effectiveness further indicates a healthy financial posture and supports its dividend strategies.
| Metric | 2024 | 2023 | 2022 |
|---|---|---|---|
| Free Cash Flow Yield | 7.13% | 6.37% | 7.00% |
| Earnings Yield | 4.22% | 4.43% | 4.38% |
| CAPEX to Operating Cash Flow | 7.89% | 7.96% | 7.35% |
| Stock-based Compensation to Revenue | 1.75% | 1.87% | 1.61% |
| Free Cash Flow / Operating Cash Flow Ratio | 92.11% | 92.04% | 92.65% |
Fortive's metrics demonstrate a sound capital structure and cash-generating capability, underpinning its potential for sustained dividend payouts.
📉 Balance Sheet & Leverage Analysis
A firm’s balance sheet strength and leverage levels impact financial flexibility and risk. Fortive maintains manageable leverage ratios, suggesting an ability to meet financial obligations while sustaining dividend consistency.
| Ratio | 2024 | 2023 | 2022 |
|---|---|---|---|
| Debt-to-Equity | 38.05% | 36.92% | 35.33% |
| Debt-to-Assets | 22.78% | 22.53% | 21.53% |
| Debt-to-Capital | 27.56% | 26.97% | 26.10% |
| Net Debt to EBITDA | 1.84 | 1.22 | 1.89 |
| Current Ratio | 0.00 | 0.00 | 0.00 |
| Quick Ratio | 91.47% | 174.99% | 71.15% |
| Financial Leverage | 1.67 | 1.64 | 1.64 |
The examination of Fortive's balance sheet underscores its prudent financial management, maintaining solid leverage while supporting ongoing dividend policies.
📊 Fundamental Strength & Profitability
Fundamental and profitability metrics highlight the company's operational efficiency and its ability to deliver returns. Fortive demonstrates sound profitability ratios, indicating a robust financial position that supports its dividend policy.
| Metric | 2024 | 2023 | 2022 |
|---|---|---|---|
| Return on Equity | 8.17% | 8.39% | 7.80% |
| Return on Assets | 4.89% | 5.12% | 4.75% |
| Margins: Net | 13.37% | 14.27% | 12.96% |
| Margins: EBIT | 18.01% | 18.37% | 16.68% |
| Margins: EBITDA | 26.74% | 25.90% | 24.67% |
| Gross Margin | 59.87% | 59.26% | 57.73% |
| Research & Development to Revenue | 6.64% | 6.56% | 6.89% |
Fortive's robust fundamentals and profitability margins signify a well-executed strategy to sustain its dividend payments while positioning itself for future growth.
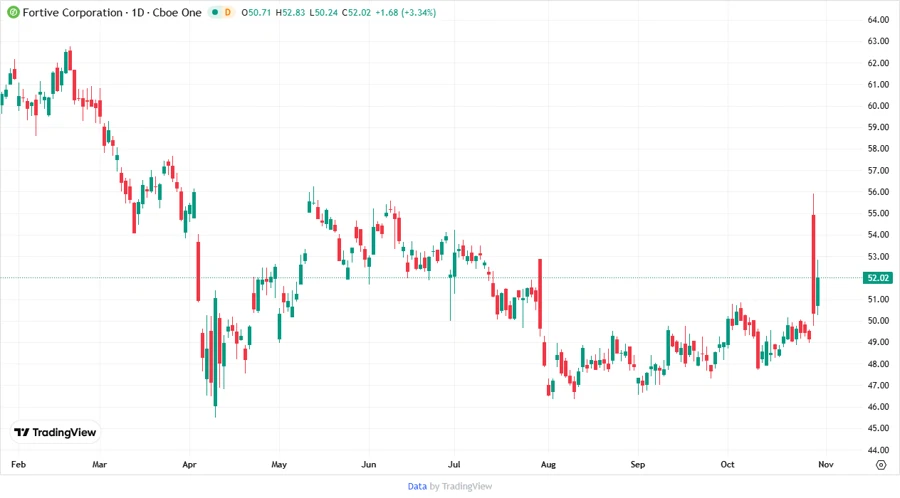
🗺️ Price Development
🧐 Dividend Scoring System
| Criterion | Score | Score Bar |
|---|---|---|
| Dividend yield | 2 | |
| Dividend Stability | 5 | |
| Dividend growth | 3 | |
| Payout ratio | 4 | |
| Financial stability | 4 | |
| Dividend continuity | 5 | |
| Cashflow Coverage | 4 | |
| Balance Sheet Quality | 4 |
Total Score: 31/40
📢 Rating
Fortive Corporation, with its strong dividend history and strategic growth initiatives, presents a solid investment for those seeking a balance between stable dividends and potential for moderate income growth. The firm’s financial policies underscore its commitment to shareholder returns, achieving an overall favorable dividend rating.
Smart Data Insight
Master the Perfect Entry & Exit for this Stock
Don't leave your profits to chance. Historically, this stock follows specific seasonal patterns that institutional traders use to maximize returns.
- ✅ Identify the "Golden Buying Window"
- ✅ Avoid high-risk correction cycles
- ✅ Backtested data from the last 20+ years