September 03, 2025 a 07:47 am

FTV: Dividend Analysis - Fortive Corporation
Fortive Corporation (FTV), with a strong presence in the manufacturing technology sector, exhibits a steady dividend policy. With a current dividend yield of 0.53% and a consistent history of distributions over the past decade, the company has demonstrated resilience and commitment to returning value to shareholders. Additionally, both short- and long-term dividend growth rates reflect moderate improvements, ensuring investor confidence. This analysis delves deeper into Fortive's dividend profile and financial stability.
📊 Overview
Fortive Corporation operates within the manufacturing technology sector. A current dividend yield of 0.53% indicates modest income potential for investors, while a decade-long dividend payment history underscores its reliability. Importantly, no recent dividend cuts or suspensions have been reported.
| Metric | Value |
|---|---|
| Sector | Manufacturing Technology |
| Dividend yield | 0.53% |
| Current dividend per share | 0.32 USD |
| Dividend history | 10 years |
| Last cut or suspension | None |
📈 Dividend History
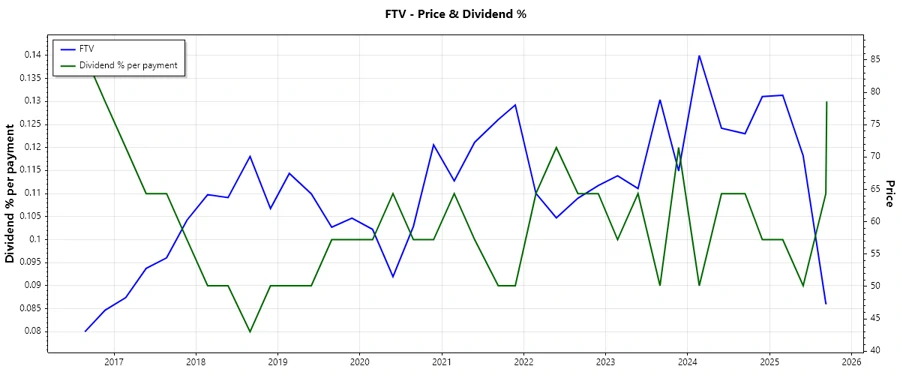
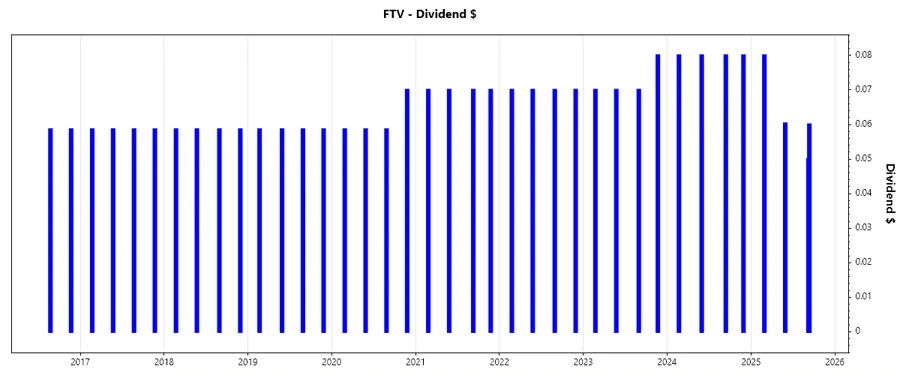
A consistent dividend history serves as a foundation for trust, particularly for long-term investors. Fortive Corporation's regular payouts over the past decade highlight its operational and financial stability.
| Year | Dividend per share (USD) |
|---|---|
| 2025 | 0.2503 |
| 2024 | 0.32 |
| 2023 | 0.29 |
| 2022 | 0.28 |
| 2021 | 0.28 |
📈 Dividend Growth
Dividend growth reflects a firm's capacity to increase shareholder payments over time. Fortive has achieved growth rates of 4.55% over three years and 6.43% over five years, illustrating a steady upward trajectory.
| Time | Growth |
|---|---|
| 3 years | 4.55% |
| 5 years | 6.43% |
The average dividend growth is 6.43% over 5 years. This shows moderate but steady dividend growth.
📉 Payout Ratio
Payout ratios offer insights into the sustainability of dividend payments from earnings (EPS) and free cash flow (FCF). Fortive's payout ratios are 14.06% (EPS-based) and 7.77% (FCF-based), which are relatively low, indicating a substantial buffer for maintaining or increasing dividends even if earnings fluctuate.
| Key figure ratio | Value |
|---|---|
| EPS-based | 14.06% |
| Free cash flow-based | 7.77% |
These low payout ratios suggest that Fortive Corporation's dividends are well-covered, with room for future growth without jeopardizing financial health.
📊 Cashflow & Capital Efficiency
Assessing Fortive's cashflow dynamics and capital efficiency reveals its operational agility. Key insights include a free cash flow yield of 8.65% and a healthy free cash flow to operating cash flow ratio of 92.11%, demonstrating effective cash generation and usage.
| Metric | 2022 | 2023 | 2024 |
|---|---|---|---|
| Free Cash Flow Yield | 5.27% | 4.80% | 5.37% |
| Earnings Yield | 3.30% | 3.34% | 3.18% |
| CAPEX to Operating Cash Flow | 7.35% | 7.96% | 7.89% |
| Stock-based Compensation to Revenue | 1.61% | 1.87% | 1.75% |
| Free Cash Flow / Operating Cash Flow Ratio | 92.65% | 92.04% | 92.11% |
The robust cashflow ratio signifies Fortive's strong capability to generate cash from its core operations, supporting dividend payouts and reinvestments.
🔍 Balance Sheet & Leverage Analysis
An analysis of Fortive's balance sheet reveals prudent fiscal management with modest leverage levels. The 2023 debt-to-equity ratio of 36.92% and a current ratio of 2.05 suggest a balanced approach to debt and healthy liquidity.
| Metric | 2022 | 2023 | 2024 |
|---|---|---|---|
| Debt-to-Equity | 35.33% | 36.92% | 38.05% |
| Debt-to-Assets | 21.53% | 22.53% | 22.78% |
| Debt-to-Capital | 26.10% | 26.97% | 27.56% |
| Net Debt to EBITDA | 1.89 | 1.22 | 1.84 |
| Current Ratio | 0.91 | 2.05 | 1.16 |
| Quick Ratio | 0.71 | 1.75 | 0.91 |
| Financial Leverage | 1.64 | 1.64 | 1.67 |
Fortive's stable debt metrics and liquidity ratios indicate prudent financial management and strong potential to weather economic shifts.
📈 Fundamental Strength & Profitability
Fortive exhibits strong profitability metrics, with a return on equity of 8.17% in 2024. Despite moderate R&D expenses, robust margins underscore its operational efficiency.
| Metric | 2022 | 2023 | 2024 |
|---|---|---|---|
| Return on Equity | 7.80% | 8.39% | 8.17% |
| Return on Assets | 4.75% | 5.12% | 4.89% |
| Net Margin | 12.96% | 14.27% | 13.37% |
| EBIT Margin | 16.68% | 18.37% | 18.01% |
| EBITDA Margin | 24.67% | 25.90% | 26.74% |
| Gross Margin | 57.73% | 59.26% | 59.87% |
| R&D to Revenue | 6.89% | 6.56% | 6.64% |
Stable profitability metrics coupled with efficient cost management underline Fortive's potential to sustain its competitive position.
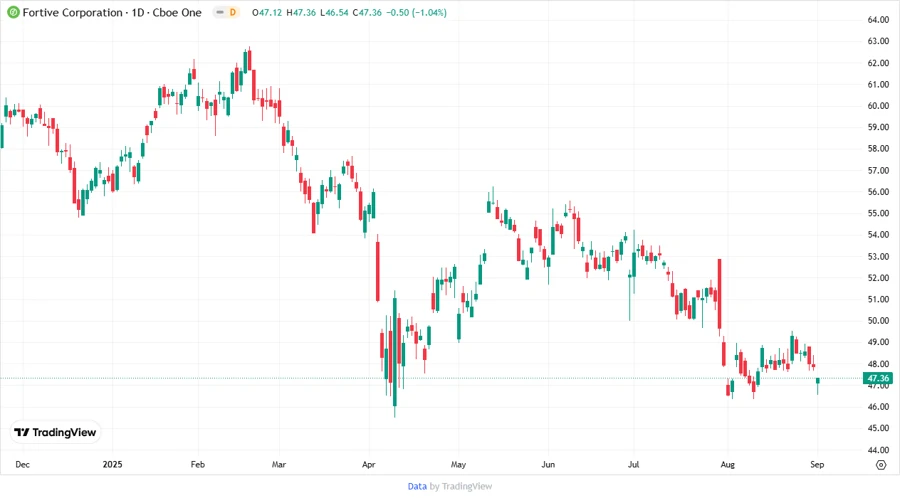
📈 Price Development
🗣️ Dividend Scoring System
| Criteria | Score | Bar |
|---|---|---|
| Dividend yield | 3.5 | |
| Dividend Stability | 4.5 | |
| Dividend growth | 4.0 | |
| Payout ratio | 5.0 | |
| Financial stability | 4.0 | |
| Dividend continuity | 4.5 | |
| Cashflow Coverage | 5.0 | |
| Balance Sheet Quality | 4.0 |
Total Score: 34/40
✅ Rating
Fortive Corporation showcases a solid dividend and financial profile. With consistent growth and prudent financial management, it is a flexible choice for income investors seeking a balance between growth and stability. Although the yield is moderate, the firm’s potential for consistent growth and income coverage is notable.