August 11, 2025 a 11:31 am


FTV: Dividend Analysis - Fortive Corporation
Fortive Corporation exhibits a steady dividend payout with a healthy record over the past decade. With a moderate dividend yield and consistent dividend growth, it positions itself as a reliable choice for income-focused investors. The payout ratios remain conservative, indicating room for potential increases. Investors may find this an attractive stock for stable income streams.
Overview
The following table provides a comprehensive view of Fortive Corporation's dividend profile, illustrating its sector, dividend yield, current dividend per share, years of dividend history, and last cut or suspension event:
| Metric | Value |
|---|---|
| Sector | Conglomerates |
| Dividend yield | 0.43 % |
| Current dividend per share | 0.32 USD |
| Dividend history | 10 years |
| Last cut or suspension | None |
Dividend History
Fortive Corporation's track record of dividend payments over the years showcases its commitment to returning value to shareholders. The regular schedule of dividends can contribute to a stable income for investors.
| Year | Dividend per Share (USD) |
|---|---|
| 2025 | 0.1403 |
| 2024 | 0.32 |
| 2023 | 0.29 |
| 2022 | 0.28 |
| 2021 | 0.28 |
Dividend Growth
Dividend growth is an essential factor in long-term investment strategies, providing an increasing income stream over time. Fortive's dividend growth over the past few years indicates its capability to boost shareholder value.
| Time | Growth |
|---|---|
| 3 years | 4.55 % |
| 5 years | 6.43 % |
The average dividend growth is 6.43 % over 5 years. This shows moderate but steady dividend growth.
Payout Ratio
Payout ratios indicate the sustainability of dividend payments relative to earnings and free cash flow. A lower payout ratio suggests room for dividend growth or resilience in adverse conditions.
| Key figure | Ratio |
|---|---|
| EPS-based | 14.06 % |
| Free cash flow-based | 7.77 % |
The lower payout ratios based on earnings and free cash flow demonstrate the company's cautious approach, effectively allowing for future growth and providing a buffer during economic downturns.
Cashflow & Capital Efficiency
Strong cash flow and efficient capital use are vital indicators of a company's health and its ability to fund dividends and future expansions.
| Metric | 2024 | 2023 | 2022 |
|---|---|---|---|
| Free Cash Flow Yield | 5.37 % | 4.80 % | 5.29 % |
| Earnings Yield | 3.18 % | 3.34 % | 3.30 % |
| CAPEX to Operating Cash Flow | 7.89 % | 7.96 % | 7.35 % |
| Stock-based Compensation to Revenue | 1.75 % | 1.87 % | 1.61 % |
| Free Cash Flow / Operating Cash Flow Ratio | 92.11 % | 92.04 % | 92.65 % |
With a robust free cash flow yield and efficient capital usage, Fortive remains well-positioned to maintain its dividend policy and explore growth opportunities.
Balance Sheet & Leverage Analysis
An analysis of Fortive's balance sheet indicates its capacity to meet financial obligations and invest in growth. Key leverage ratios are pivotal for understanding financial stability and the company's approach to debt management.
| Metric | 2024 | 2023 | 2022 |
|---|---|---|---|
| Debt-to-Equity | 38.05 % | 36.92 % | 33.58 % |
| Debt-to-Assets | 22.78 % | 22.53 % | 20.46 % |
| Debt-to-Capital | 27.56 % | 26.97 % | 25.14 % |
| Net Debt to EBITDA | 2.06 | 1.22 | 1.73 |
| Current Ratio | 0.96 | 2.05 | 0.91 |
| Quick Ratio | 0.91 | 1.75 | 0.71 |
| Financial Leverage | 1.67 | 1.64 | 1.64 |
The leverage ratios indicate Fortive's prudent use of debt, offering a stable financial base to support future endeavors and dividend commitments.
Fundamental Strength & Profitability
Fortive's strong returns on equity and assets, combined with robust profit margins, highlight its operational efficiency and market competitiveness.
| Metric | 2024 | 2023 | 2022 |
|---|---|---|---|
| Return on Equity | 8.17 % | 8.39 % | 7.80 % |
| Return on Assets | 4.89 % | 5.12 % | 4.75 % |
| Margins: Net | 13.37 % | 14.27 % | 12.96 % |
| EBIT | 18.01 % | 18.37 % | 17.26 % |
| EBITDA | 26.74 % | 25.90 % | 25.25 % |
| Gross | 59.87 % | 59.26 % | 57.73 % |
| Research & Development to Revenue | 6.64 % | 6.56 % | 6.89 % |
Fortive's consistent performance and strategic investments in research and development ensure its competitive position and profitability sustainability.
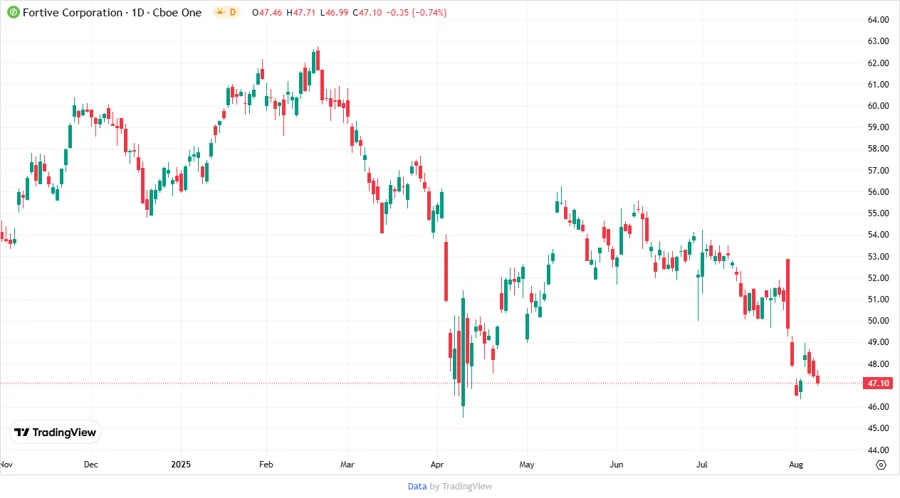
Price Development
Dividend Scoring System
| Criteria | Details | Score |
|---|---|---|
| Dividend yield | Moderate | |
| Dividend Stability | Consistent history | |
| Dividend growth | Moderate | |
| Payout ratio | Low | |
| Financial stability | Strong | |
| Dividend continuity | No cuts/suspensions | |
| Cashflow Coverage | Ample | |
| Balance Sheet Quality | Resilient |
Total Score: 59/80
Rating
Fortive Corporation appears to be a strong candidate for investors seeking stable and growing dividends. With its solid financials, consistent payout history, and room for future growth, it garners a positive recommendation for long-term dividend investment strategies.
Smart Data Insight
Master the Perfect Entry & Exit for this Stock
Don't leave your profits to chance. Historically, this stock follows specific seasonal patterns that institutional traders use to maximize returns.
- ✅ Identify the "Golden Buying Window"
- ✅ Avoid high-risk correction cycles
- ✅ Backtested data from the last 20+ years