November 01, 2025 a 01:15 pm
FTNT: Trend and Support & Resistance Analysis - Fortinet, Inc.
Fortinet, Inc., a leader in cybersecurity solutions, has shown a moderate recovery in its stock prices after a significant downturn a few months ago. The current analysis focuses on identifying recent trends and key support and resistance levels to predict future price movement. Given the strategic alliances and innovative solutions offered by Fortinet, the stock presents a potential opportunity for growth despite past volatility.
Trend Analysis
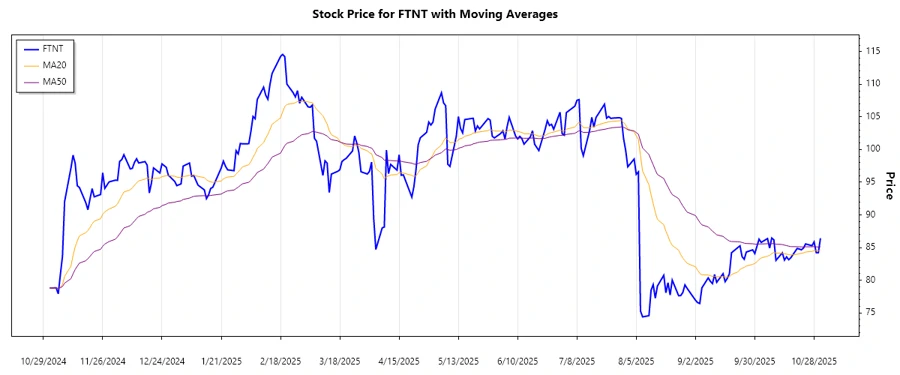
Analyzing the recent historical data of Fortinet, Inc., the EMA20 and EMA50 have been calculated. The analysis of the last seven days reveals the prevailing trend, represented by colored arrows.
| Date | Close Price | Trend |
|---|---|---|
| 2025-10-31 | $86.43 | ▲ |
| 2025-10-30 | $84.20 | ▼ |
| 2025-10-29 | $84.22 | ▲ |
| 2025-10-28 | $85.87 | ▲ |
| 2025-10-27 | $85.29 | ▲ |
| 2025-10-24 | $85.56 | ▲ |
| 2025-10-23 | $84.93 | ▲ |
Currently, the EMA20 exceeds the EMA50, indicating a minor ▲ upward trend.
Support and Resistance
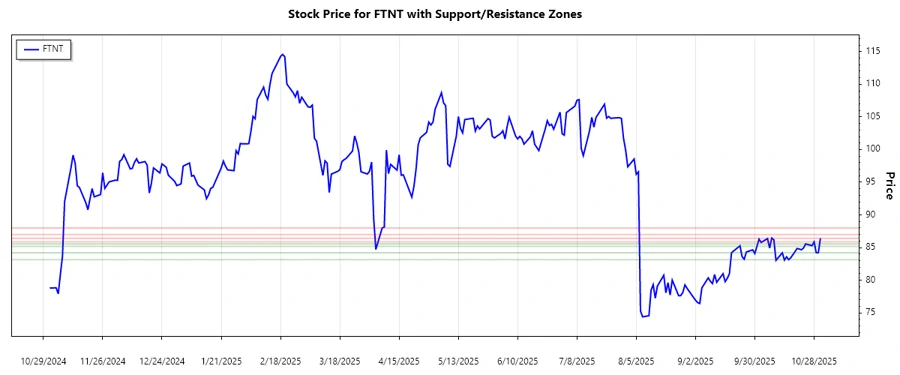
Based on historical data, crucial support and resistance zones have been calculated, presenting key levels of interest.
| Zone Type | From | To | |
|---|---|---|---|
| Support | $83.14 | $84.21 | ▼ |
| Support | $85.18 | $85.56 | ▼ |
| Resistance | $85.87 | $86.43 | ▲ |
| Resistance | $87.00 | $88.00 | ▲ |
The current price is approaching the nearest resistance zone, suggesting potential testing and validation of this level.
Conclusion
Fortinet, Inc.'s stock is gradually recovering, indicating potential opportunities given the current upward trend. The strategic positioning of its product offerings places it at a competitive advantage. However, investors must remain vigilant of resistance levels that could challenge further gains. As the price approaches resistance zones, analysts should closely monitor for breakout confirmation or reversal cues to capitalize on potential market movements.