
June 29, 2026 a 08:00 am

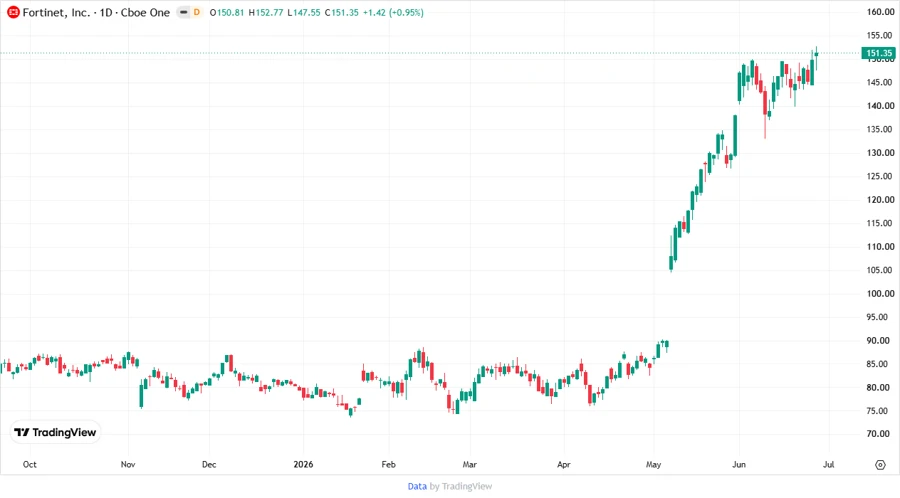
FTNT: Fundamental Ratio Analysis - Fortinet, Inc.
Fortinet, Inc. is a key player in the cybersecurity domain, offering a range of integrated security products. The company's stock showcases a stable performance, with strong financial scores in key areas such as return on equity and assets. It remains a reliable contender within the tech industry, albeit with some challenges in debt management.
Fundamental Rating
The fundamental analysis of FTNT reveals a commendable performance in return metrics, though debt management is a noted risk.
| Category | Score | Visualization |
|---|---|---|
| Discounted Cash Flow | 3 | |
| Return On Equity | 5 | |
| Return On Assets | 5 | |
| Debt To Equity | 2 | |
| Price To Earnings | 2 | |
| Price To Book | 1 |
Historical Rating
The historical view provides insight into past and current ratings, showcasing consistency in key fundamental areas.
| Date | Overall | DCF | ROE | ROA | D/E | P/E | P/B |
|---|---|---|---|---|---|---|---|
| 2026-06-25 | 3 | 3 | 5 | 5 | 2 | 2 | 1 |
| N/A | 0 | 3 | 5 | 5 | 2 | 2 | 1 |
Analyst Price Targets
Recent targets suggest a stable range for FTNT, with room for growth based on median expectations.
| High | Low | Median | Consensus |
|---|---|---|---|
| 155 | 70 | 95 | 98.95 |
Analyst Sentiment
Analysts predominantly hold a neutral stance on FTNT, with a majority advising to hold the stock.
| Recommendation | Count | Visualization |
|---|---|---|
| Strong Buy | 0 | |
| Buy | 30 | |
| Hold | 32 | |
| Sell | 6 | |
| Strong Sell | 0 |
Conclusion
FTNT presents itself as a well-rounded stock with stable scores across fundamental metrics, making it a reliable choice for investors interested in technology and cybersecurity. Despite some challenges in debt management, the company's robust return on equity and assets contribute to its appeal. Analysts suggest a holding strategy, indicating cautious optimism about its future performance. The company's broad reach in cybersecurity solutions positions it well for potential growth, although market competition and economic stability remain areas to monitor.
Smart Data Insight
Master the Perfect Entry & Exit for this Stock
Don't leave your profits to chance. Historically, this stock follows specific seasonal patterns that institutional traders use to maximize returns.
- ✅ Identify the "Golden Buying Window"
- ✅ Avoid high-risk correction cycles
- ✅ Backtested data from the last 20+ years