August 19, 2025 a 05:15 am

FTNT: Fibonacci Analysis - Fortinet, Inc.
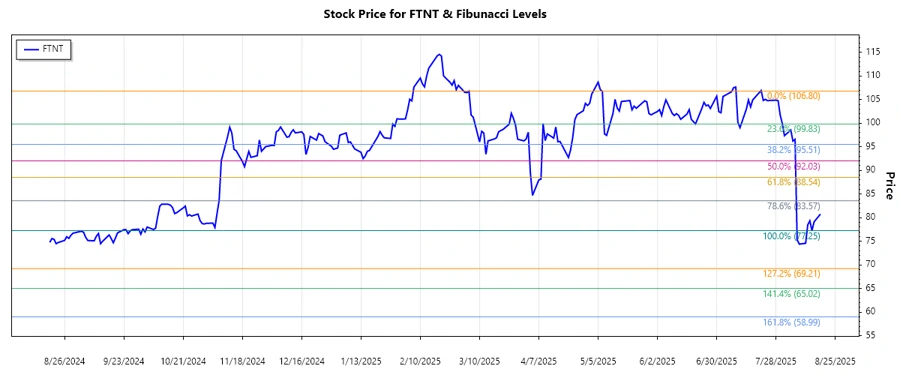
Fortinet, Inc., a leader in cybersecurity solutions, has shown significant market movements in the last few months. The stock exhibited a notable downward trend from early March 2025 to mid-August 2025. As the market assesses the company's strategic moves and resilience in changing economic conditions, the current technical indicators provide valuable insights. Here, we present a detailed analysis using Fibonacci retracement levels to predict potential support and resistance zones.
Fibonacci Analysis
| Description | Date | Price |
|---|---|---|
| Start of Trend | 2025-03-05 | 106.8 |
| End of Trend | 2025-08-14 | 77.25 |
| High | 2025-03-05 | 106.8 |
| Low | 2025-08-14 | 77.25 |
| Current Price | 2025-08-18 | 80.76 |
| Fibonacci Level | Price Level |
|---|---|
| 0.236 | 98.311 |
| 0.382 | 93.062 |
| 0.5 | 92.025 |
| 0.618 | 86.987 |
| 0.786 | 81.831 |
The current price of Fortinet is within the 0.786 retracement level. This suggests a potential support level, where investors might see buying opportunities or a pause in selling pressure. Technically, this zone could serve as a critical point for potential reversal or consolidation.
Conclusion
Fortinet, Inc. has been navigating a broad downtrend, marked by volatile sessions. The Fibonacci levels suggest key zones of interest where the downward momentum might decelerate, allowing for potential recovery phases. While the 0.786 level indicates a supportive base, caution is advised as further downside risk remains if this support is breached. Analysts would be keenly observing fundamentals and external market conditions as they integrate these technical signals into their broader risk assessments. Resilient performance in global cybersecurity arenas could aid recovery, but vigilance remains crucial amid fluctuating demand and potential economic headwinds.
Smart Data Insight
Master the Perfect Entry & Exit for this Stock
Don't leave your profits to chance. Historically, this stock follows specific seasonal patterns that institutional traders use to maximize returns.
- ✅ Identify the "Golden Buying Window"
- ✅ Avoid high-risk correction cycles
- ✅ Backtested data from the last 20+ years