
July 15, 2026 a 10:15 am
FRT: Fibonacci Analysis - Federal Realty Investment Trust
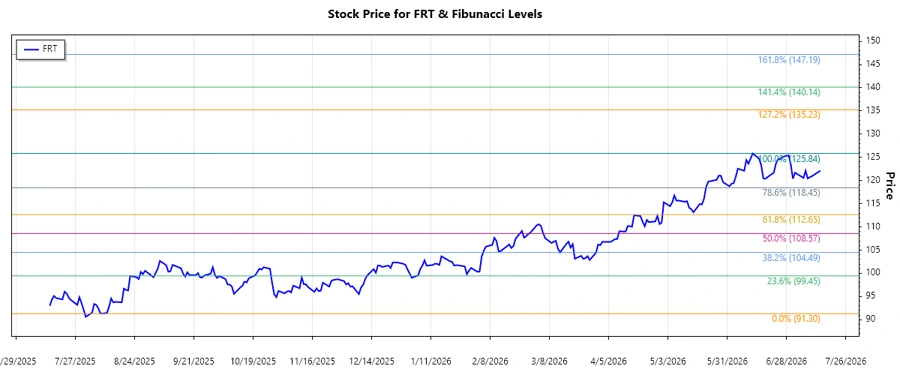
Federal Realty Investment Trust (FRT) has shown a stable performance in the recent past, benefiting from its strategic investments in high-demand retail areas. As a constituent of the S&P 500, FRT's consistent dividend growth highlights its financial resilience. However, market fluctuations have impacted its recent stock trends, making technical analysis essential for potential investors.
Fibonacci Analysis
| Analysis Details | Information |
|---|---|
| Start Date | 2025-08-08 |
| End Date | 2026-06-12 |
| High Point | $125.84 on 2026-06-12 |
| Low Point | $91.3 on 2025-08-08 |
| 0.236 Level | $99.97 |
| 0.382 Level | $105.02 |
| 0.5 Level | $108.57 |
| 0.618 Level | $112.11 |
| 0.786 Level | $116.96 |
| Current Price Zone | $122.11 - Above 0.786 Level |
| Interpretation | The current price being above the 0.786 level indicates the possibility of a strong continuation in the upward trend, with potential support found at previous retracement levels. |
Conclusion
Federal Realty Investment Trust (FRT) exhibits strong upward trending momentum as indicated by its breach of the 0.786 Fibonacci Retracement level. This bullish sentiment is supported by strategic asset positioning and robust financial practices. However, investors should consider potential risks from broader market volatility and economic shifts impacting retail demand. Analysts view a breach above the 0.786 level as a signal of possible further gains, but remain cautious of resistance near previous highs. Potential investors should weigh the long-term growth prospects against these marketplace dynamics. Overall, FRT remains a compelling investment for those seeking stable dividend returns coupled with growth potential.
Smart Data Insight
Master the Perfect Entry & Exit for this Stock
Don't leave your profits to chance. Historically, this stock follows specific seasonal patterns that institutional traders use to maximize returns.
- ✅ Identify the "Golden Buying Window"
- ✅ Avoid high-risk correction cycles
- ✅ Backtested data from the last 20+ years