January 18, 2026 a 03:15 pm

FRT: Fibonacci Analysis - Federal Realty Investment Trust
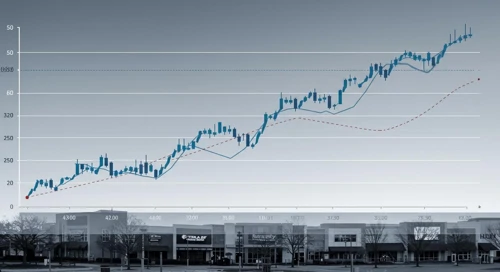
Federal Realty Investment Trust (FRT) is showing resilience with a recent uptrend. Its strategic focus on high-quality retail-based properties in major coastal markets positions it well for sustainable growth. The consistent dividend growth over 54 years highlights its strong financial management, offering reassurance to long-term investors.
Fibonacci Analysis
| Detail | Information |
|---|---|
| Start Date | 2025-08-08 |
| End Date | 2025-12-02 |
| High Price | $103.67 (2026-01-16) |
| Low Price | $91.3 (2025-08-08) |
| Fibonacci Level | Price |
|---|---|
| 0.236 | $96.3 |
| 0.382 | $98.57 |
| 0.5 | $100.04 |
| 0.618 | $101.51 |
| 0.786 | $103.54 |
The current price is around $103.67, positioning it in the 0.786 retracement zone. This level serves as potential resistance, indicating possible difficulty for the price to rise above this level without additional bullish momentum.
Conclusion
Federal Realty Investment Trust (FRT) is steadily maintaining its upward trajectory. The resilience shown through its strategic investments in high-demand areas and consistent dividend returns makes it a strong candidate for long-term portfolios. However, the current price hovering at the 0.786 Fibonacci level could suggest near-term resistance, implying that investors should be cautious of potential market corrections if broader economic conditions change. A breakthrough at this level, confirmed by positive market news, could see FRT testing new highs, providing an attractive entry point for bullish investors.