October 03, 2025 a 03:15 pm
FRT: Fibonacci Analysis - Federal Realty Investment Trust
Federal Realty Investment Trust is a resilient player in the retail real estate sector, demonstrating a robust upward trend in recent months. The company's capacity to increase quarterly dividends for 54 consecutive years reflects its solid operational foundation and financial health. Market participants have observed a consistent upward momentum, potentially indicating continued investor confidence in its strategic portfolio of high-quality properties.
Fibonacci Analysis
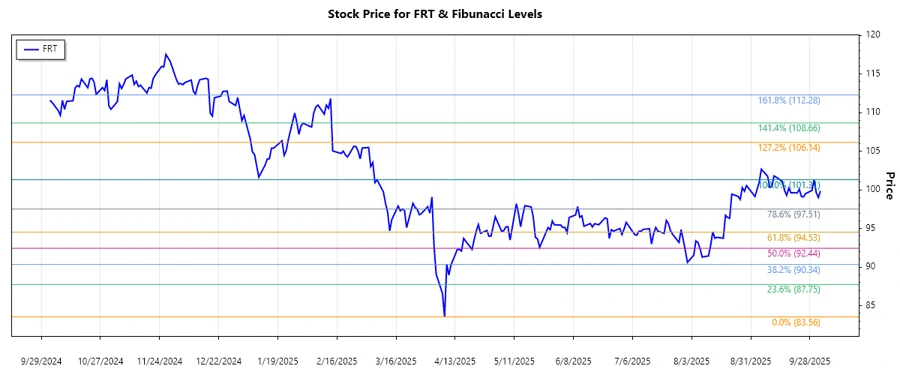
The analysis focuses on the recent upward trend in FRT from June to October 2025. Within this period, there’s a high degree of investor optimism, reflected in the rising prices supported by strong community-centered property investments.
| Detail | Information |
|---|---|
| Trend Period | June 2025 - October 2025 |
| High Point | 101.31 on 2025-03-07 |
| Low Point | 83.56 on 2025-04-08 |
| Fibonacci Level | Price Level |
|---|---|
| 0.236 | 87.90 |
| 0.382 | 90.80 |
| 0.5 | 92.44 |
| 0.618 | 94.08 |
| 0.786 | 96.63 |
The current price of 99.86, noted on 2025-10-03, indicates that the FRT stock is experiencing a minor pullback within the bullish trend but remains above significant Fibonacci retracement levels, specifically between the 0.618 and 0.786 levels. This positions these levels as potential support zones.
Conclusion
Federal Realty Investment Trust continues to showcase strong technical fundamentals as seen in its upward price momentum. The short retracement seen in the analyzed period suggests healthy market consolidation. For analysts, this indicates potential entry points, especially as prices move between key Fibonacci retracement levels. However, vigilance is advised given market volatility which may affect broader trends. Long-term prospects remain bullish provided the company sustains dividend growth and capitalizes on strategic property investments.
Smart Data Insight
Master the Perfect Entry & Exit for this Stock
Don't leave your profits to chance. Historically, this stock follows specific seasonal patterns that institutional traders use to maximize returns.
- ✅ Identify the "Golden Buying Window"
- ✅ Avoid high-risk correction cycles
- ✅ Backtested data from the last 20+ years