
June 02, 2026 a 07:31 am

FRT: Dividend Analysis - Federal Realty Investment Trust
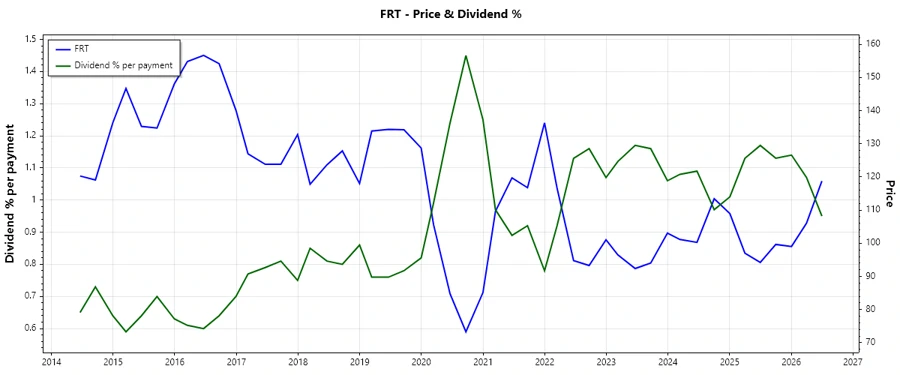
Federal Realty Investment Trust demonstrates a robust dividend profile with a remarkable history of 40 years of dividend payments, indicating strong stability and a commitment to shareholders. Despite a moderate dividend yield of 3.81%, the company's consistent dividend history is a testament to its financial resilience. Investors may find the stable dividend growth rate an attractive feature, making FRT a potential candidate for income-focused portfolios.
📊 Overview
Analyzing Federal Realty Investment Trust's dividend profile reflects its commitment to providing returns to shareholders. With an attractive sector positioning and a commendable dividend yield, the company shows promising potential for dividend sustainability.
| Metric | Details |
|---|---|
| Sector | Real Estate |
| Dividend yield | 3.81% |
| Current dividend per share | 4.52 USD |
| Dividend history | 40 years |
| Last cut or suspension | None |
🗣️ Dividend History
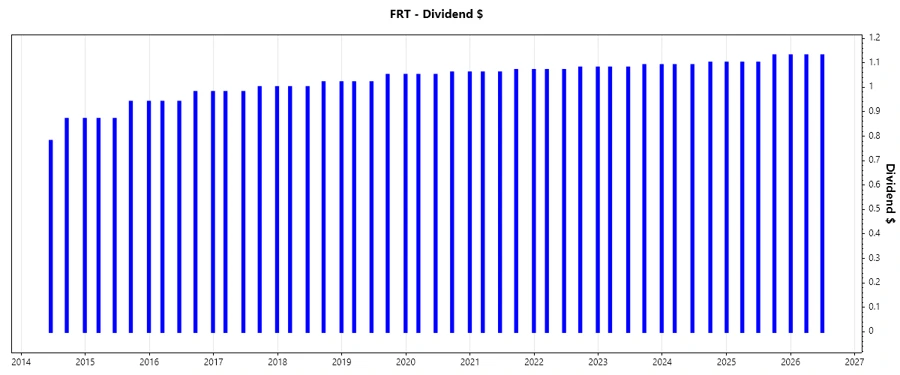
Understanding the dividend history is crucial for assessing a firm's fidelity to shareholder returns. FRT's history of continuous dividend payments over the decades is a solid indicator of financial stability.
| Year | Dividend per Share (USD) |
|---|---|
| 2026 | 3.39 |
| 2025 | 4.43 |
| 2024 | 3.28 |
| 2023 | 4.34 |
| 2022 | 4.30 |
📈 Dividend Growth
Examining dividend growth offers insight into how a company has increased shareholder value over time. The steady, albeit modest, growth signifies the company's sustainable approach to dividend policies.
| Time | Growth |
|---|---|
| 3 years | 1.00% |
| 5 years | 0.98% |
The average dividend growth is 0.98% over 5 years. This shows moderate but steady dividend growth.
✅ Payout Ratio
The payout ratio is a critical measure for evaluating the dividend’s sustainability concerning profits and cash flows. FRT's payout ratios suggest a strong, yet managed, distribution strategy.
| Key figure | Ratio |
|---|---|
| EPS-based | 76.80% |
| Free cash flow-based | 73.79% |
An EPS payout ratio of 76.80% alongside an FCF payout ratio of 73.79% signals a healthy distribution policy, balanced against earnings and cash flow generation capacity.
⚖️ Cashflow & Capital Efficiency
The assessment of cash flow and capital efficiency reflects the firm's ability to sustain operations, invest in growth, and continue its dividend payout policy without compromising financial health.
| Year | 2025 | 2024 | 2023 |
|---|---|---|---|
| Free Cash Flow Yield | 3.83% | 3.50% | 2.92% |
| Earnings Yield | 4.75% | 3.16% | 2.83% |
| CAPEX to Operating Cash Flow | 46.81% | 42.95% | 55.97% |
| Stock-based Compensation to Revenue | 1.14% | 1.36% | 1.26% |
| Free Cash Flow / Operating Cash Flow Ratio | 53.19% | 57.05% | 44.03% |
The cash flow ratios reveal FRT’s robust cash flow management, maintaining healthy capital allocations while sustaining dividend payouts.
📉 Balance Sheet & Leverage Analysis
Assessing the balance sheet and leverage metrics offers insights into the company’s financial stability, liquidity, and capital structure efficiency.
| Year | 2025 | 2024 | 2023 |
|---|---|---|---|
| Debt-to-Equity | 154.78% | 143.82% | 158.18% |
| Debt-to-Assets | 55.07% | 53.51% | 55.56% |
| Debt-to-Capital | 60.75% | 58.99% | 61.27% |
| Net Debt to EBITDA | 5.06 | 5.40 | 6.02 |
| Current Ratio | 1.02 | 1.16 | 1.55 |
| Quick Ratio | 1.02 | 1.16 | 1.55 |
| Financial Leverage | 2.81 | 2.69 | 2.85 |
These metrics illustrate a prudent management of debt levels in relation to assets and equity, alongside maintaining satisfactory liquidity.
📊 Fundamental Strength & Profitability
Evaluating fundamental strength and profitability metrics is essential for understanding the firm’s operational efficacy and margin management.
| Year | 2025 | 2024 | 2023 |
|---|---|---|---|
| Return on Equity | 12.65% | 9.31% | 8.00% |
| Return on Assets | 4.50% | 3.46% | 2.81% |
| Margins: Net | 32.15% | 24.55% | 20.93% |
| Margins: EBIT | 47.29% | 39.90% | 36.66% |
| Margins: EBITDA | 76.06% | 68.39% | 65.08% |
| Margins: Gross | 97.28% | 67.42% | 67.93% |
| Research & Development to Revenue | 0% | 0% | 0% |
The profitability metrics underscore FRT's successful management of operational efficiencies amidst varying economic landscapes.
Price Development
📈 Dividend Scoring System
| Criterion | Score | Bar |
|---|---|---|
| Dividend yield | 3 | |
| Dividend Stability | 5 | |
| Dividend growth | 2 | |
| Payout ratio | 4 | |
| Financial stability | 3 | |
| Dividend continuity | 5 | |
| Cashflow Coverage | 3 | |
| Balance Sheet Quality | 3 |
Total Score: 28/40
🗣️ Rating
Federal Realty Investment Trust offers moderate dividend attractiveness with robust stability and continuity features. While growth prospects remain steady, continued observation is recommended for potential impacts from market fluctuations on earnings yield and cash flow provisions. Overall, FRT stands as a reliable dividend payer with viable long-term returns.
Smart Data Insight
Master the Perfect Entry & Exit for this Stock
Don't leave your profits to chance. Historically, this stock follows specific seasonal patterns that institutional traders use to maximize returns.
- ✅ Identify the "Golden Buying Window"
- ✅ Avoid high-risk correction cycles
- ✅ Backtested data from the last 20+ years