May 18, 2026 a 03:31 am

FRT: Dividend Analysis - Federal Realty Investment Trust
Federal Realty Investment Trust showcases a robust dividend profile with a long-standing history of growth. As a testament to its reliability, it maintains a significant track record backed by its strong market capitalization and stable financial ratios.
📊 Overview
The following overview provides essential insights into Federal Realty Investment Trust's dividend profile and sector positioning. The company operates within a well-defined sector, exhibiting a commendable balance between dividend yield and history.
| Metric | Value |
|---|---|
| Sector | Real Estate |
| Dividend Yield | 3.99% |
| Current Dividend per Share | 4.52 USD |
| Dividend History | 40 years |
| Last Cut or Suspension | None |
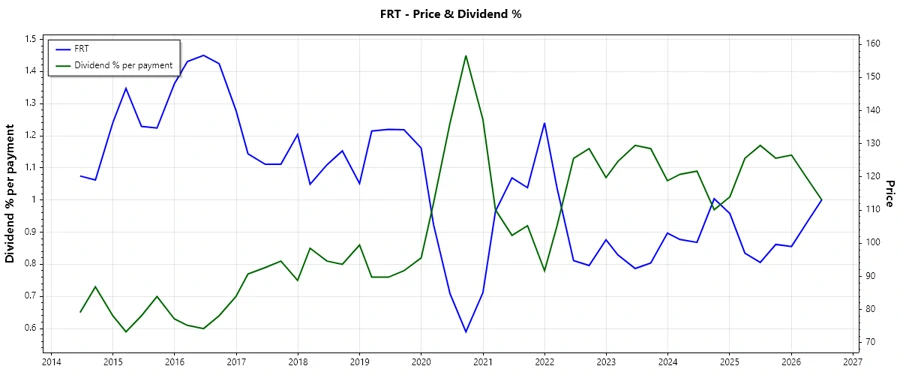
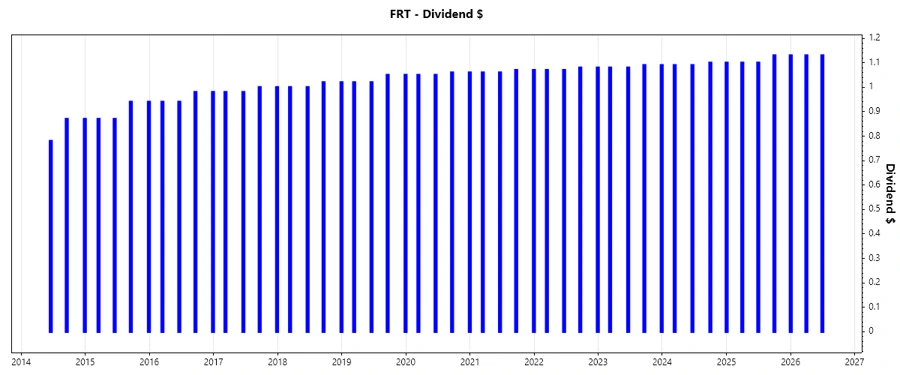
🗣️ Dividend History
Examining the dividend history of Federal Realty Investment Trust is crucial for evaluating its consistency and reliability in payouts within the market. The longevity of dividend payments provides confidence to investors.
| Year | Dividend per Share (USD) |
|---|---|
| 2026 | 3.39 |
| 2025 | 4.43 |
| 2024 | 3.28 |
| 2023 | 4.34 |
| 2022 | 4.30 |
📈 Dividend Growth
Dividend growth is a critical component in assessing a company's fiscal health and shareholder return capacity. Growth rates over recent years highlight Federal Realty's strategy in progressive shareholder value enhancement.
| Time | Growth |
|---|---|
| 3 years | 0.98% |
| 5 years | 0.98% |
The average dividend growth is 0.98% over 5 years. This shows moderate but steady dividend growth.
⚠️ Payout Ratio
Payout ratios shed light on Federal Realty's distribution strategy, providing insight into its prudent financial management balancing retained earnings and shareholder payouts.
| Key figure | Ratio |
|---|---|
| EPS-based | 76.80% |
| Free cash flow-based | 73.79% |
The EPS-based payout ratio of 76.80% and the free cash flow-based ratio of 73.79% indicate a balance that allows both substantial shareholder returns and re-investments into growth opportunities without over-leveraging finances.
✅ Cashflow & Capital Efficiency
Cashflow and capital efficiency metrics are fundamental indicators of operational effectiveness and resource allocation efficacy. They provide a snapshot of how well the company converts its cash into growth and returns.
| Metric | 2025 | 2024 | 2023 |
|---|---|---|---|
| Free Cash Flow Yield | 3.83% | 3.50% | 2.92% |
| Earnings Yield | 4.75% | 3.16% | 2.83% |
| CAPEX to Operating Cash Flow | 46.81% | 42.95% | 55.97% |
| Stock-based Compensation to Revenue | 1.14% | 1.36% | 1.26% |
| Free Cash Flow / Operating Cash Flow Ratio | 53.19% | 57.05% | 44.03% |
Robust cash flow yields and moderate capital efficiency metrics underscore the company's strategic resource optimization, ensuring sustainable growth while maintaining liquidity for future ventures.
Balance Sheet & Leverage Analysis
Analyzing Federal Realty's balance sheet metrics provides clarity on its financial resilience and agility. Solvency and liquidity ratios offer a clear view of its debt levels in relation to equity and assets.
| Metric | 2025 | 2024 | 2023 |
|---|---|---|---|
| Debt-to-Equity | 1.55 | 1.44 | 1.58 |
| Debt-to-Assets | 0.55 | 0.54 | 0.56 |
| Debt-to-Capital | 0.61 | 0.59 | 0.61 |
| Net Debt to EBITDA | 5.06 | 5.40 | 6.02 |
| Current Ratio | 1.02 | 1.16 | 1.55 |
| Quick Ratio | 1.02 | 1.16 | 1.55 |
| Financial Leverage | 2.81 | 2.69 | 2.85 |
FRT maintains a prudent approach to leverage, balancing debt with accessible cash flow, reflected in stable liquidity ratios across consecutive fiscal years.
Fundamental Strength & Profitability
| Metric | 2025 | 2024 | 2023 |
|---|---|---|---|
| Return on Equity | 12.65% | 9.31% | 8.00% |
| Return on Assets | 4.50% | 3.46% | 2.81% |
| Net Margin | 32.15% | 24.55% | 20.93% |
| EBIT Margin | 47.29% | 39.90% | 36.66% |
| EBITDA Margin | 76.06% | 68.39% | 65.08% |
| Gross Margin | 9.73% | 67.42% | 67.93% |
| Research & Development to Revenue | 0% | 0% | 0% |
Federal Realty's high margins and robust returns on equity and assets reflect its operational effectiveness, promoting investor confidence through sustained profitability.
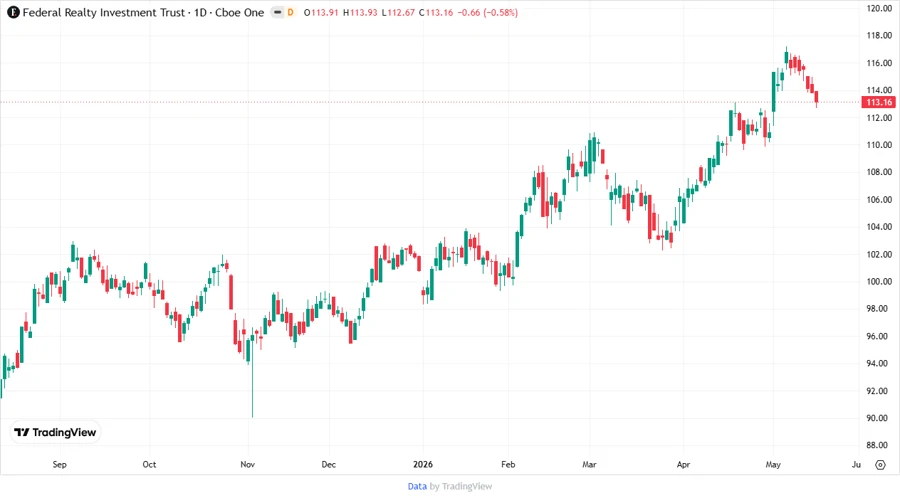
🔎 Price Development
🏅 Dividend Scoring System
| Category | Score | |
|---|---|---|
| Dividend yield | 3 | |
| Dividend Stability | 5 | |
| Dividend growth | 2 | |
| Payout ratio | 4 | |
| Financial stability | 4 | |
| Dividend continuity | 5 | |
| Cashflow Coverage | 3 | |
| Balance Sheet Quality | 4 |
Total Score: 30/40
🌟 Rating
Federal Realty Investment Trust is a reliable investment option, evidenced by its steady dividend track and robust financial structure. Our analysis scores the company with 30 out of 40 in our customized dividend scoring system, suggesting a good investment opportunity for income-focused investors desiring stable returns and capital growth.
Smart Data Insight
Master the Perfect Entry & Exit for this Stock
Don't leave your profits to chance. Historically, this stock follows specific seasonal patterns that institutional traders use to maximize returns.
- ✅ Identify the "Golden Buying Window"
- ✅ Avoid high-risk correction cycles
- ✅ Backtested data from the last 20+ years