
April 25, 2026 a 11:31 am

FRT: Dividend Analysis - Federal Realty Investment Trust
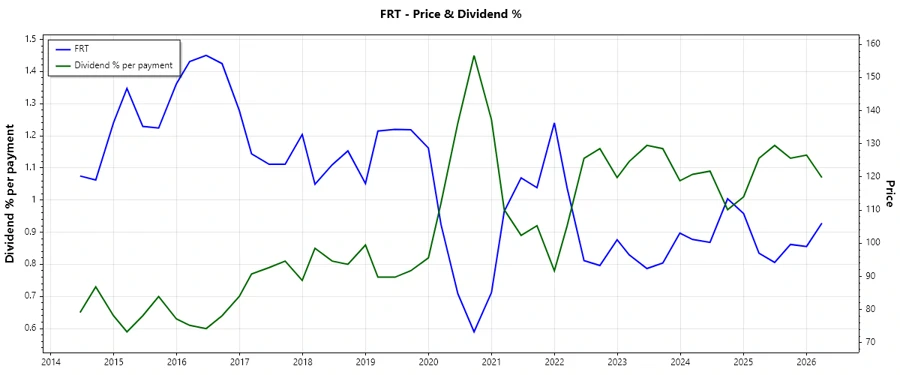
Federal Realty Investment Trust (FRT) presents an intriguing option for dividend-oriented investors with its extensive dividend history and stable market presence. However, the current payout ratios suggest that the management should focus on sustainable dividend payouts to ensure long-term stability. The firm's ability to maintain its dividend record without cuts for over 40 years adds to its credit, making it a reliable option in the real estate sector.
📊 Overview
Federal Realty Investment Trust operates in the real estate sector, offering a dividend yield of 4.23% with a current dividend per share set at 4.52 USD. With a robust 40-year history of dividend payouts, it is a consistent performer with no recent cuts.
| Metric | Value |
|---|---|
| Sector | Real Estate |
| Dividend Yield | 4.23% |
| Current Dividend per Share | 4.52 USD |
| Dividend History | 40 years |
| Last Cut or Suspension | None |
🗣️ Dividend History
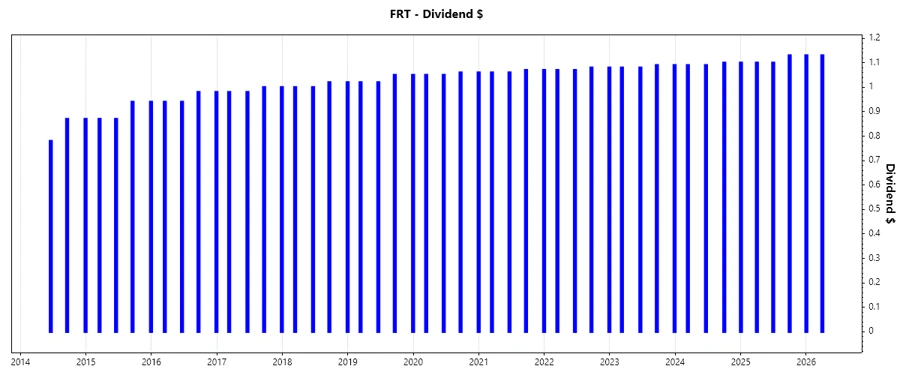
Analyzing historical dividend trends is crucial for understanding the company's payout consistency and growth. The solid dividend history indicates FRT's commitment to returning profits to investors.
| Year | Dividend per Share (USD) |
|---|---|
| 2026 | 2.26 |
| 2025 | 4.43 |
| 2024 | 3.28 |
| 2023 | 4.34 |
| 2022 | 4.30 |
📈 Dividend Growth
Dividend growth is a key indicator of a company's financial health and its management's commitment to increasing payouts. FRT shows limited growth over both 3 and 5 years, indicating stable yet modest increases.
| Time | Growth |
|---|---|
| 3 years | 1.00% |
| 5 years | 0.98% |
The average dividend growth is 0.98% over 5 years. This shows moderate but steady dividend growth.
⚠️ Payout Ratio
The payout ratio is a critical measure of dividend sustainability. FRT's high EPS-based payout ratio at 94.54% indicates that nearly all of its earnings are distributed as dividends. The FCF-based ratio of 73.82% suggests a slightly better cash flow coverage.
| Key figure | Ratio |
|---|---|
| EPS-based | 94.54% |
| Free cash flow-based | 73.82% |
The high payout ratios highlight the need for careful monitoring of earnings vis-à-vis dividend payouts to ensure financial health.
✅ Cashflow & Capital Efficiency
Investigating cash flow stability and capital efficiency gives insight into the company's ability to maintain dividends and invest in growth. The ratios are compared yearly to assess trends and predict future performance.
| Year | 2025 | 2024 | 2023 |
|---|---|---|---|
| Free Cash Flow Yield | 3.83% | 3.50% | 2.92% |
| Earnings Yield | 4.75% | 3.16% | 2.83% |
| CAPEX to Operating Cash Flow | 46.81% | 42.95% | 55.97% |
| Stock-based Compensation to Revenue | 1.14% | 1.36% | 1.26% |
| Free Cash Flow / Operating Cash Flow Ratio | 53.19% | 57.05% | 44.03% |
Despite some volatility, cash flows appear generally stable, providing adequate coverage for ongoing dividend commitments.
📉 Balance Sheet & Leverage Analysis
Understanding leverage and balance sheet composition is crucial for determining financial flexibility and managing risk. The analysis covers critical debt metrics that impact financial stability.
| Year | 2025 | 2024 | 2023 |
|---|---|---|---|
| Debt-to-Equity | 1.55 | 1.44 | 1.58 |
| Debt-to-Assets | 0.55 | 0.54 | 0.56 |
| Debt-to-Capital | 0.61 | 0.59 | 0.61 |
| Net Debt to EBITDA | 5.06 | 5.40 | 6.02 |
| Current Ratio | 1.02 | 1.16 | 1.55 |
| Quick Ratio | 1.02 | 1.16 | 1.55 |
| Financial Leverage | 2.81 | 2.69 | 2.85 |
There is a moderate level of leverage which warrants careful management to avoid overexposure.
🪙 Fundamental Strength & Profitability
Assessing profitability indicates how efficiently a company is generating revenue compared to its expenses. This metric helps forecast potential for future earnings and dividends.
| Year | 2025 | 2024 | 2023 |
|---|---|---|---|
| Return on Equity | 12.65% | 9.31% | 8.00% |
| Return on Assets | 4.50% | 3.46% | 2.81% |
| Margins: Net | 32.15% | 24.55% | 20.93% |
| EBIT | 47.29% | 39.90% | 36.66% |
| EBITDA | 76.06% | 68.39% | 65.08% |
| Gross | 9.73% | 67.42% | 67.93% |
| R&D to Revenue | 0.00% | 0.00% | 0.00% |
Profitability showcases a solid foundation; however, optimization is necessary for higher margins in the competitive market.
Price Development
🔍 Dividend Scoring System
| Criteria | Score | Score Bar |
|---|---|---|
| Dividend Yield | 4 | |
| Dividend Stability | 5 | |
| Dividend Growth | 2 | |
| Payout Ratio | 3 | |
| Financial Stability | 3 | |
| Dividend Continuity | 5 | |
| Cashflow Coverage | 3 | |
| Balance Sheet Quality | 3 |
36 / 40
📊 Rating
The comprehensive analysis reveals that Federal Realty Investment Trust remains a solid consideration for dividend investors, displaying impressive stability and continuity in its distribution despite facing growth constraints. Prospective investors should appraise financial metrics closely due to high payout ratios, but FRT's distinctive market reliability suggests a favorable addition to a dividend-focused portfolio.
Smart Data Insight
Master the Perfect Entry & Exit for this Stock
Don't leave your profits to chance. Historically, this stock follows specific seasonal patterns that institutional traders use to maximize returns.
- ✅ Identify the "Golden Buying Window"
- ✅ Avoid high-risk correction cycles
- ✅ Backtested data from the last 20+ years