April 08, 2026 a 03:31 am

FRT: Dividend Analysis - Federal Realty Investment Trust
Federal Realty Investment Trust has been a robust player in the real estate investment sector for decades. With a track record of 40 years of dividend history, the firm exhibits commendable dividend stability. Current dividend yields are attractive, supported by a relatively high market cap. The company's commitment to its dividends, despite market volatilities, is admirable, though challenges in payout ratios warrant close monitoring. This analysis delves into various facets of FRT's financial and dividend health to provide a comprehensive perspective for shareholders and potential investors alike.
📊 Overview
Federal Realty Investment Trust operates within the real estate sector, demonstrating resilience and a strong financial foundation with a respectable dividend history.
| Metric | Value |
|---|---|
| Sector | Real Estate |
| Dividend Yield | 4.23% |
| Current Dividend per Share | 4.52 USD |
| Dividend History | 40 years |
| Last Cut or Suspension | None |
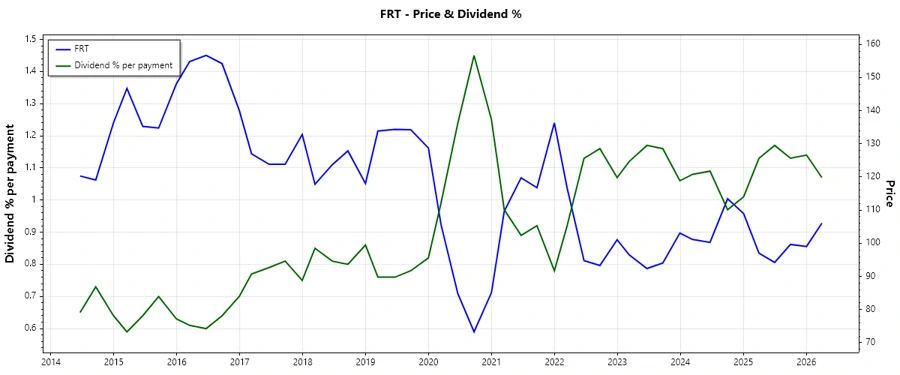
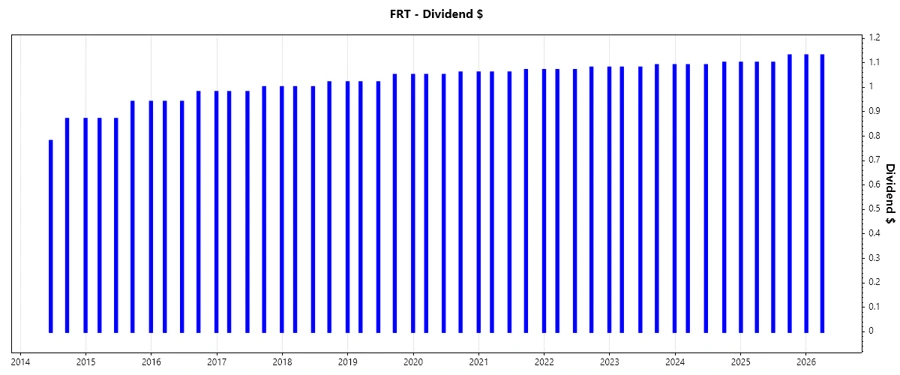
📉 Dividend History
FRT’s commitment to maintaining a long-standing dividend payment history enhances its credibility among income-seeking investors. A consistent dividend payment record over four decades indicates financial robustness and operational stability, crucial factors in value preservation.
| Year | Dividend per Share (USD) |
|---|---|
| 2026 | 2.26 |
| 2025 | 4.43 |
| 2024 | 3.28 |
| 2023 | 4.34 |
| 2022 | 4.30 |
📈 Dividend Growth
Dividend growth is indicative of a company's ability to increase shareholder returns consistently, showcasing both financial health and commitment to shareholder wealth. Federal Realty's modest dividend growth over the past years demonstrates their steady financial strategy.
| Time | Growth |
|---|---|
| 3 years | 0.99% |
| 5 years | 0.97% |
The average dividend growth is 0.97% over 5 years. This shows moderate but steady dividend growth.
🗣️ Payout Ratio
Payout ratios illustrate a company's ability to sustain its dividend payments in relation to its earnings and cash flow. While a high EPS-based payout ratio of 94.54% suggests potential vulnerability in dividend sustainability, a lower FCF-based payout ratio of 73.82% indicates a more conservative perspective on dividend allocation.
| Key Figure | Ratio |
|---|---|
| EPS-based | 94.54% |
| Free Cash Flow-based | 73.82% |
These ratios reveal that while the EPS payout ratio is quite high, the FCF payout ratio is more conservative, indicating a potential risk in dividend sustainability should earnings weaken substantially.
✅ Cashflow & Capital Efficiency
A company's cash flow and capital efficiency metrics shed light on operational strength and the ability to invest in future growth. Posted figures reflect FRT's strategies in managing cash flow and capital expenses effectively.
| Metric | 2025 | 2024 | 2023 |
|---|---|---|---|
| Free Cash Flow Yield | 5.72% | 3.82% | 2.92% |
| Earnings Yield | 4.46% | 4.75% | 2.83% |
| CAPEX to Operating Cash Flow | 15.12% | 46.81% | 55.97% |
| Stock-based Compensation to Revenue | 1.14% | 1.36% | 1.26% |
| Free Cash Flow / Operating Cash Flow Ratio | 53.19% | 57.05% | 44.03% |
Federal Realty exhibits solid cash management efficiency, which underpins its capital return capabilities. The fluctuation in CAPEX suggests adaptability in capital allocations relative to operational cash flow, crucial in volatile market conditions.
⚠️ Balance Sheet & Leverage Analysis
Balance sheet metrics provide insights into the company's financial leverage and debt management practices, essential for assessing financial health and risk level.
| Metric | 2025 | 2024 | 2023 |
|---|---|---|---|
| Debt-to-Equity | 1.55 | 1.44 | 1.58 |
| Debt-to-Assets | 55.07% | 53.51% | 55.56% |
| Debt-to-Capital | 60.75% | 58.99% | 61.27% |
| Net Debt to EBITDA | 5.06 | 5.40 | 6.02 |
| Current Ratio | 1.02 | 1.16 | 1.55 |
| Quick Ratio | 1.02 | 1.16 | 1.55 |
| Financial Leverage | 2.81 | 2.69 | 2.85 |
The leverage ratios indicate that Federal Realty maintains a high level of debt relative to equity, which could be a risk factor during economic downturns. Nevertheless, liquidity ratios suggest adequate short-term financial stability.
✅ Fundamental Strength & Profitability
Profitability metrics assess a company's efficiency in generating profits from its resources, crucial for shareholder value enhancement.
| Metric | 2025 | 2024 | 2023 |
|---|---|---|---|
| Return on Equity | 12.65% | 9.31% | 7.99% |
| Return on Assets | 4.50% | 3.46% | 2.81% |
| Net Profit Margin | 32.15% | 24.55% | 20.93% |
| EBIT Margin | 47.29% | 39.90% | 36.66% |
| EBITDA Margin | 76.06% | 68.39% | 65.08% |
| Gross Margin | 9.72% | 67.42% | 67.93% |
| Research & Development to Revenue | 0% | 0% | 0% |
Federal Realty's profitability metrics reflect solid returns on equity and assets, indicating effective management in resource utilization. However, an absence of R&D expenditure is noted, potentially impacting future innovation capabilities.
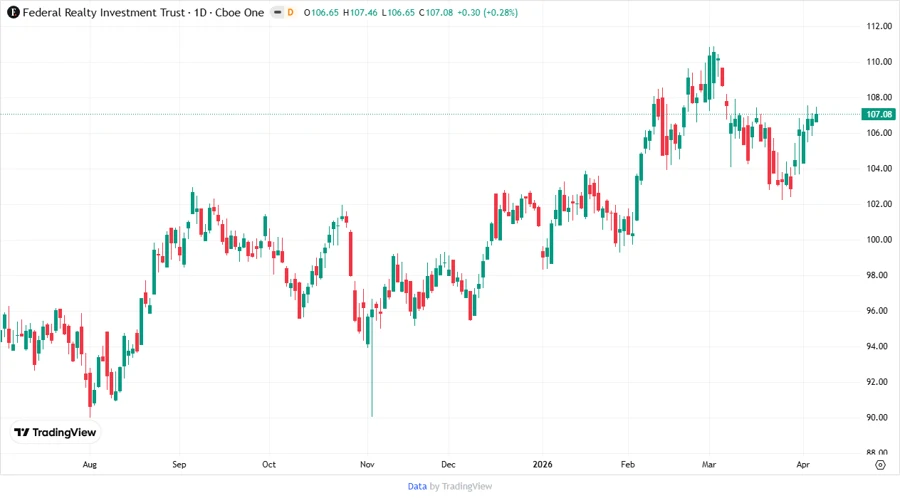
📈 Price Development
🗣️ Dividend Scoring System
The Dividend Scoring System evaluates FRT's dividend performance across various key criteria, providing a holistic view of the company's ability to sustain dividend payouts.
| Category | Score (1-5) | Score Bar |
|---|---|---|
| Dividend Yield | 4 | |
| Dividend Stability | 5 | |
| Dividend Growth | 3 | |
| Payout Ratio | 3 | |
| Financial Stability | 4 | |
| Dividend Continuity | 5 | |
| Cashflow Coverage | 4 | |
| Balance Sheet Quality | 3 |
Overall Score: 31 out of 40
✅ Rating
Overall, Federal Realty Investment Trust provides a formidable investment opportunity for dividend-centered investors due to its strong dividend history and moderate growth potential. While its high payout ratio poses risks, the financial robustness and stable cash flows offset these concerns to some extent. Investors seeking sustainable income should consider FRT as an integral part of their portfolios, given its commitment to long-term dividend payout and financial stability.