June 15, 2025 a 03:31 pm


FRT: Dividend Analysis - Federal Realty Investment Trust
Federal Realty Investment Trust presents a compelling dividend opportunity with its consistent history of returns. The trust has managed to maintain a stable dividend yield, although recent challenges have influenced growth metrics negatively. Nevertheless, their long-term commitment to dividend payments exemplifies resilience in changing market conditions.
📊 Overview
Federal Realty Investment Trust operates within the real estate sector, offering a substantial dividend yield of 4.62%. Despite an attractive current dividend per share of 4.45 USD, the dividend history extends up to 39 years, indicating strong continuity. The last recorded dividend cut or suspension was in 2024, cautioning investors about ongoing market volatilities.
| Attribute | Details |
|---|---|
| Sector | Real Estate |
| Dividend Yield | 4.62% |
| Current Dividend Per Share | 4.45 USD |
| Dividend History | 39 years |
| Last Cut/Suspension | 2024 |
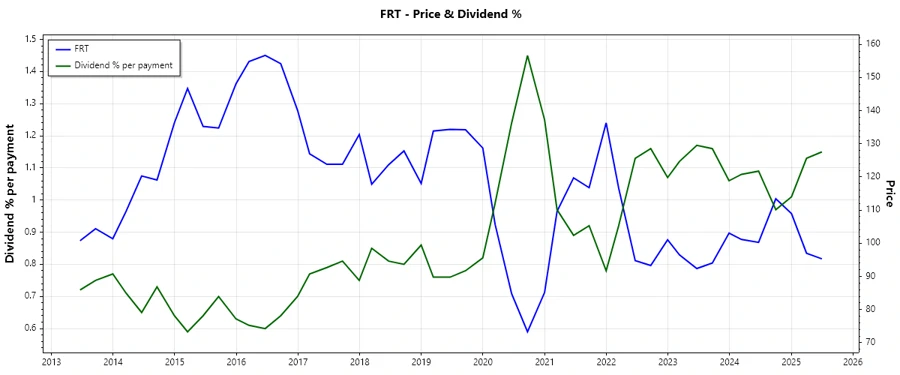
📈 Dividend History
The dividend history of Federal Realty Investment Trust spans several decades and provides evidence of its commitment to rewarding shareholders. The consistency in dividend payments highlights a traditionally robust financial strategy and a focus on shareholder returns.
| Year | Dividend Per Share |
|---|---|
| 2025 | 3.30 |
| 2024 | 3.28 |
| 2023 | 4.34 |
| 2022 | 4.30 |
| 2021 | 4.26 |
📉 Dividend Growth
Analyzing dividend growth is essential for evaluating future income potential. Over the past 3 and 5 years, Federal Realty Investment Trust shows a negative growth pattern, complicating prospects for income appreciation.
| Time | Growth |
|---|---|
| 3 years | -8.35% |
| 5 years | -4.55% |
The average dividend growth is -4.55% over 5 years. This shows moderate but steady dividend growth challenges.
🗣️ Payout Ratio
Evaluating payout ratios is critical to understanding the sustainability of dividends. Federal Realty maintains a high payout ratio, with 125.76% based on EPS, and 103.37% based on Free Cash Flow, suggesting caution as divesting excessive profits could strain financial health.
| Key Figure | Ratio |
|---|---|
| EPS-based | 125.76% |
| Free Cash Flow-based | 103.37% |
These ratios indicate potential risks in maintaining current dividend levels unless earnings improve or cash flow increases substantially.
✅ Cashflow & Capital Efficiency
Understanding cash flow dynamics and capital efficiency provides insights into the financial robustness. The key figures highlight a moderate Free Cash Flow Yield and Earnings Yield, with efficiency metrics like CAPEX to Operating Cash Flow illustrating reinvestment strategies.
| Metric | 2024 | 2023 | 2022 |
|---|---|---|---|
| Free Cash Flow Yield | 3.50% | 2.92% | 1.24% |
| Earnings Yield | 3.16% | 2.83% | 3.16% |
| CAPEX to Operating Cash Flow | 39.48% | 55.97% | 80.64% |
| Stock-based Compensation to Revenue | 1.36% | 1.26% | 1.28% |
| Free Cash Flow / Operating Cash Flow Ratio | 57.05% | 44.03% | 19.36% |
The analysis reflects moderate capital efficiency but indicates room for improvement, particularly in transforming operating cash flow into free cash flow.
⚠️ Balance Sheet & Leverage Analysis
Balance sheet metrics provide insights into financial health and risk. Federal Realty's debt ratios suggest a leveraged position, necessitating vigilance on liquidity and overall financial stability.
| Metric | 2024 | 2023 | 2022 |
|---|---|---|---|
| Debt-to-Equity | 1.44 | 1.58 | 1.51 |
| Debt-to-Assets | 0.54 | 0.56 | 0.54 |
| Debt-to-Capital | 0.59 | 0.61 | 0.60 |
| Net Debt to EBITDA | 5.45 | 6.02 | 5.30 |
| Current Ratio | 1.03 | 0.67 | 0.95 |
| Quick Ratio | 0.52 | 0.67 | 1.81 |
| Financial Leverage | 2.69 | 2.85 | 2.79 |
Leverage is high, implying potential risks but manageable with effective liquidity management strategies.
🧬 Fundamental Strength & Profitability
Key profitability ratios such as Return on Equity and Assets provide insights into efficiency and financial health. Margins remain respectable, stressing the firm's ability to control costs and drive profits.
| Metric | 2024 | 2023 | 2022 |
|---|---|---|---|
| Return on Equity | 9.31% | 7.99% | 8.62% |
| Return on Assets | 3.46% | 2.81% | 3.09% |
| Net Margin | 24.55% | 20.93% | 23.71% |
| EBIT Margin | 39.90% | 36.66% | 49.58% |
| EBITDA Margin | 67.77% | 65.08% | 77.14% |
| Gross Margin | 67.42% | 67.93% | 66.79% |
| R&D to Revenue | 0% | 0% | 0% |
Profitability indicators are fairly strong, showcasing the firm's efficiency in utilizing assets and equity to generate returns.
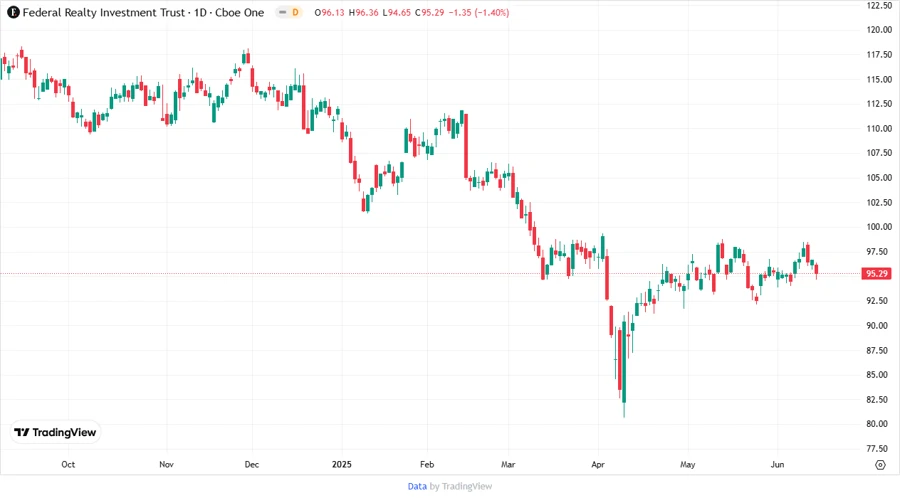
🏦 Price Development
🔍 Dividend Scoring System
| Category | Rating | Score |
|---|---|---|
| Dividend Yield | 4 | |
| Dividend Stability | 3 | |
| Dividend Growth | 2 | |
| Payout Ratio | 2 | |
| Financial Stability | 3 | |
| Dividend Continuity | 3 | |
| Cashflow Coverage | 3 | |
| Balance Sheet Quality | 3 |
Total Score: 23/40
📝 Rating
Federal Realty Investment Trust demonstrates a moderate to strong dividend profile amidst current market challenges. Despite recent setbacks in growth and a high payout ratio, their long-standing reliability in delivering dividends makes it a cautiously optimistic choice for income-focused investors seeking stability in a fluctuating market environment.
Smart Data Insight
Master the Perfect Entry & Exit for this Stock
Don't leave your profits to chance. Historically, this stock follows specific seasonal patterns that institutional traders use to maximize returns.
- ✅ Identify the "Golden Buying Window"
- ✅ Avoid high-risk correction cycles
- ✅ Backtested data from the last 20+ years