May 11, 2026 a 11:43 am

FOX: Fundamental Ratio Analysis - Fox Corporation
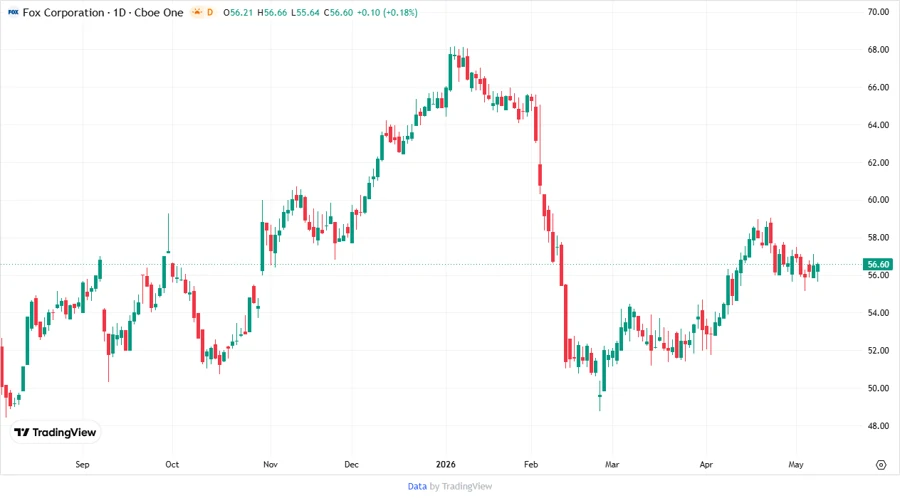
Fox Corporation, a prominent player in the U.S. entertainment industry, showcases a profound foothold in news, sports, and television broadcasting. The company's diversified segments emphasize its robust market positioning. As of now, the stock's valuation reflects these fundamental strengths, making it a subject of interest for potential investors.
Fundamental Rating
Based on current evaluations, Fox Corporation exhibits strong fundamentals with promising outlooks in key ratios.
| Category | Score | Visualization |
|---|---|---|
| Discounted Cash Flow | 5 | |
| Return on Equity | 4 | |
| Return on Assets | 5 | |
| Debt to Equity | 2 | |
| Price to Earnings | 3 | |
| Price to Book | 2 |
Historical Rating
The historical data indicates consistent performance in key metrics, underlying Fox Corporation's stable market position.
| Date | Overall | DCF | ROE | ROA | D/E | P/E | P/B |
|---|---|---|---|---|---|---|---|
| 2026-05-08 | 4 | 5 | 4 | 5 | 2 | 3 | 2 |
| Previous | 0 | 5 | 4 | 5 | 2 | 3 | 2 |
Analyst Price Targets
Current analyst estimates reveal stable and optimistic price targets, exemplifying market confidence in Fox Corporation’s trajectory.
| High | Low | Median | Consensus |
|---|---|---|---|
| $85 | $85 | $85 | $85 |
Analyst Sentiment
The sentiment among analysts reveals a trend towards holding, with a fair distribution across varying recommendation levels.
| Recommendation | Count | Visualization |
|---|---|---|
| Strong Buy | 0 | |
| Buy | 18 | |
| Hold | 20 | |
| Sell | 4 | |
| Strong Sell | 0 |
Conclusion
Fox Corporation stands as a formidable entity within the entertainment industry, with its diversified portfolio cementing its competitive edge. The fundamental ratings paint a picture of a company with strong returns, albeit with moderate debt levels. Analyst price targets underscore optimism, though the "Hold" consensus suggests potential investors may want to await more compelling signals. As market dynamics evolve, vigilance towards both opportunities and challenges will be key for stakeholders.
Smart Data Insight
Master the Perfect Entry & Exit for this Stock
Don't leave your profits to chance. Historically, this stock follows specific seasonal patterns that institutional traders use to maximize returns.
- ✅ Identify the "Golden Buying Window"
- ✅ Avoid high-risk correction cycles
- ✅ Backtested data from the last 20+ years