
June 27, 2026 a 12:46 pm
FOX: Dividend Analysis - Fox Corporation
Fox Corporation exhibits a stable dividend profile with moderate growth over the years. The company maintains a healthy payout ratio, bolstered by strong cash flows and efficient capital allocation. As the firm continues to navigate its sector, its dividend strategy demonstrates both resilience and potential for income-focused investors.
📊 Overview
Fox Corporation operates primarily in the media and entertainment sector. It's characterized by a dividend yield of 1.05%, which aligns with industry standards. With a current dividend per share of $0.60, it maintains a steady distribution to its shareholders. The company has a 7-year streak of consistent dividend payments, showcasing its commitment to rewarding investors, while the absence of recent cuts underscores its fiscal discipline.
| Metric | Value |
|---|---|
| Sector | Media and Entertainment |
| Dividend yield | 1.05% |
| Current dividend per share | $0.60 USD |
| Dividend history | 7 years |
| Last cut or suspension | None |
🗣️ Dividend History
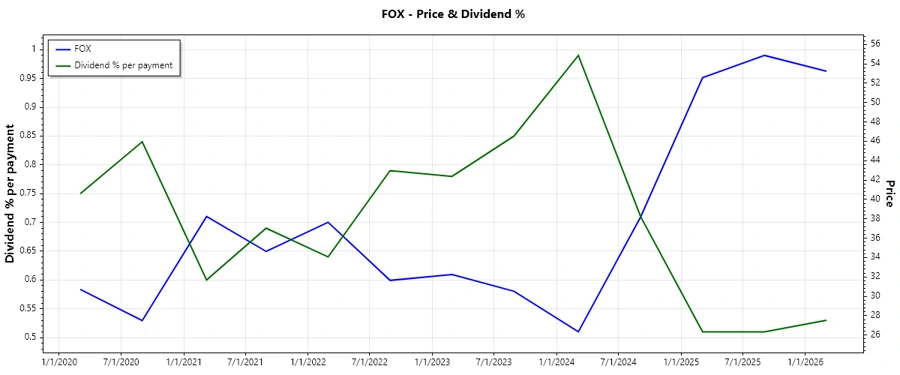
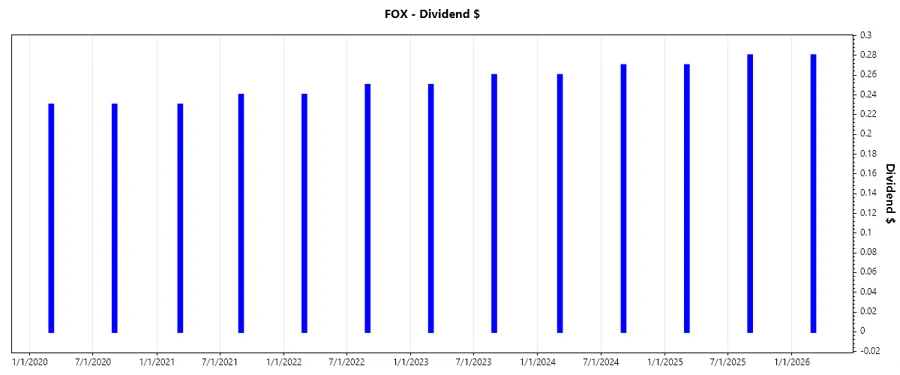
The historical dividend payments from Fox Corporation offer insights into its reliable payout strategy. Regular dividend payments indicate confidence in cash flow generation and market conditions. Examining historical data is crucial for predicting future dividend stability.
| Year | Dividend per Share (USD) |
|---|---|
| 2026 | $0.28 |
| 2025 | $0.55 |
| 2024 | $0.53 |
| 2023 | $0.51 |
| 2022 | $0.49 |
📈 Dividend Growth
Understanding the growth in dividends gives an outlook on the company's potential for future income increase. A steady growth pattern indicates strong underlying financial health and a commitment to increased shareholder return.
| Time | Growth |
|---|---|
| 3 years | 3.93% |
| 5 years | 3.64% |
The average dividend growth is 3.64% over 5 years. This shows moderate but steady dividend growth.
✅ Payout Ratio
The payout ratio assists in determining how sustainable a company's dividend is. A lower ratio may indicate more potential for future dividend growth, while a higher ratio can indicate better immediate shareholder returns or insufficient profit reinvestment.
| Key figure | Ratio |
|---|---|
| EPS-based | 14.89% |
| Free cash flow-based | 11.16% |
With an EPS-based payout ratio of 14.89% and an FCF-based payout ratio of 11.16%, Fox Corporation demonstrates a conservative dividend policy, implying ample retained earnings and financial resiliency.
📊 Cashflow & Capital Efficiency
Cashflow measures are essential in evaluating a company's capability to cover dividend payments from its consistent cash generation. Efficient capital use further enhances the company's financial flexibility.
| Year | 2023 | 2024 | 2025 |
|---|---|---|---|
| Free Cash Flow Yield | 8.52% | 9.84% | 12.57% |
| Earnings Yield | 7.32% | 9.87% | 9.51% |
| CAPEX to Operating Cash Flow | 19.83% | 18.75% | 9.95% |
| Stock-based Compensation to Revenue | 0.50% | 0.64% | 0.83% |
| Free Cash Flow / Operating Cash Flow Ratio | 80.17% | 81.25% | 90.04% |
The firm demonstrates a strong cash flow profile with stable CAPEX allocation, underpinning robust dividend coverage and reinvestment potential.
📉 Balance Sheet & Leverage Analysis
A thorough balance sheet assessment reveals a company's financial health, liquidity position, and potential risks related to its debt profile.
| Year | 2023 | 2024 | 2025 |
|---|---|---|---|
| Debt-to-Equity | 79.08% | 76.09% | 62.41% |
| Debt-to-Assets | 37.53% | 37.10% | 32.18% |
| Debt-to-Capital | 44.16% | 43.21% | 38.43% |
| Net Debt to EBITDA | 1.58x | 1.32x | 0.55x |
| Current Ratio | 1.93 | 2.54 | 2.91 |
| Quick Ratio | 1.78 | 2.33 | 2.76 |
| Financial Leverage | 2.11 | 2.05 | 1.94 |
Balanced leverage ratios combined with a stable current and quick ratio indicate sound financial stability and prudent capital management.
📊 Fundamental Strength & Profitability
Profitability ratios quantify a company's ability to generate income relative to revenue, assets, and equity, which are crucial for long-term growth and dividend sustainability.
| Year | 2023 | 2024 | 2025 |
|---|---|---|---|
| Return on Equity | 11.94% | 14.01% | 18.92% |
| Return on Assets | 5.67% | 6.83% | 9.76% |
| Net Margin | 8.31% | 10.74% | 13.88% |
| Gross Margin | 100% | 100% | 33.11% |
| EBIT Margin | 13.98% | 17.95% | 21.25% |
| EBITDA Margin | 16.74% | 20.73% | 23.61% |
| R&D to Revenue | 0% | 0% | 0% |
Strong ROE and ROA, combined with solid margins, highlight Fox Corporation's operational efficiency and profitability prowess.
📈 Price Development
✅ Dividend Scoring System
| Category | Score (1-5) | Score Bar |
|---|---|---|
| Dividend yield | 3 | |
| Dividend Stability | 4 | |
| Dividend growth | 3 | |
| Payout ratio | 5 | |
| Financial stability | 4 | |
| Dividend continuity | 4 | |
| Cashflow Coverage | 5 | |
| Balance Sheet Quality | 4 |
Total Score: 32/40
🔍 Rating
Fox Corporation is rated favorably for its consistent dividend policy and stable financial metrics. With a robust financial stability score and prudent payout approach, it is a reliable option for income-seeking investors aiming for moderate growth. The company’s strategy presents a balanced risk-and-reward profile attractive to long-term dividend investors.
Smart Data Insight
Master the Perfect Entry & Exit for this Stock
Don't leave your profits to chance. Historically, this stock follows specific seasonal patterns that institutional traders use to maximize returns.
- ✅ Identify the "Golden Buying Window"
- ✅ Avoid high-risk correction cycles
- ✅ Backtested data from the last 20+ years