May 14, 2026 a 03:31 am


FOX: Dividend Analysis - Fox Corporation
Fox Corporation presents a diverse and solid dividend profile with a current yield of approximately 1.05%. The notable aspect of Fox's dividend approach is its consistency over the past eight years, signifying reliability. With a conservative payout ratio, the company seems well-positioned to sustain its dividend payments, indicting promise for shareholders seeking income-generating investments.
📊 Overview
The dividend landscape of Fox Corporation highlights its stability and growth-oriented philosophy within the Communication Services sector. Below is a summary of its key figures:
| Attribute | Details |
|---|---|
| Sector | Communication Services |
| Dividend Yield | 1.05% |
| Current Dividend Per Share | 0.60 USD |
| Dividend History | 8 years |
| Last Cut or Suspension | None |
🗣️ Dividend History
The historical track record of dividends is crucial, as it reflects the company's financial health and management's commitment to shareholder returns. Fox Corporation has consistently upheld dividend payments, enhancing investor confidence.
| Year | Dividend Per Share (USD) |
|---|---|
| 2026 | 0.28 |
| 2025 | 0.55 |
| 2024 | 0.53 |
| 2023 | 0.51 |
| 2022 | 0.49 |
📈 Dividend Growth
Analyzing the company’s capacity to increase dividends over time depicts its financial prosperity and long-term growth trajectory. Below shows recent dividend growth rates:
| Time | Growth |
|---|---|
| 3 years | 3.93% |
| 5 years | 3.64% |
The average dividend growth is 3.64% over 5 years. This shows moderate but steady dividend growth, reflecting the company’s potential for future expansion.
📉 Payout Ratio
The payout ratio measures the proportion of earnings and cash flow distributed as dividends, thus indicating the sustainability of payouts.
| Key Figure | Ratio |
|---|---|
| EPS-based | 14.89% |
| Free Cash Flow-based | 11.16% |
With an EPS-based payout ratio of 14.89% and a free cash flow payout ratio of 11.16%, Fox Corporation showcases a prudent approach, ensuring dividend coverage while allowing for reinvestment in growth opportunities.
✅ Cashflow & Capital Efficiency
Robust cash flow and capital efficiency are vital metrics assessing how efficiently a company converts its investments into profits.
| Measure | 2025 | 2024 | 2023 |
|---|---|---|---|
| Free Cash Flow Yield | 12.57% | 9.84% | 8.52% |
| Earnings Yield | 9.51% | 9.87% | 7.32% |
| CAPEX to Operating Cash Flow | 9.96% | 18.75% | 19.83% |
| Stock-based Compensation to Revenue | 0.83% | 0.64% | 0.50% |
| Free Cash Flow / Operating Cash Flow Ratio | 90.04% | 81.25% | 80.17% |
With favorable cash flow yields and solid earnings performance, Fox Corporation demonstrates efficient capital usage, pivotal for long-term financial stability.
⚠️ Balance Sheet & Leverage Analysis
Balance sheet metrics provide insights into a company’s liquidity, leverage, and overall financial health, crucial for assessing risk and capitalization strategies.
| Measure | 2025 | 2024 | 2023 |
|---|---|---|---|
| Debt-to-Equity | 0.62 | 0.76 | 0.79 |
| Debt-to-Assets | 0.32 | 0.37 | 0.38 |
| Debt-to-Capital | 0.38 | 0.43 | 0.44 |
| Net Debt to EBITDA | 0.55 | 1.32 | 1.57 |
| Current Ratio | 2.91 | 2.54 | 1.93 |
| Quick Ratio | 2.76 | 2.33 | 1.78 |
| Financial Leverage | 1.94 | 2.05 | 2.11 |
Fox Corporation's leverage ratios indicate a sound capital structure and robust liquidity cushion, providing resilience against economic challenges.
📈 Fundamental Strength & Profitability
Profitability metrics encompass the company's efficiency in generating returns, crucial for assessing its operational performance and attractiveness for investors.
| Measure | 2025 | 2024 | 2023 |
|---|---|---|---|
| Return on Equity | 18.92% | 14.01% | 11.94% |
| Return on Assets | 9.76% | 6.83% | 5.67% |
| Margins: Net | 13.88% | 10.74% | 8.31% |
| EBIT Margin | 21.25% | 17.95% | 13.98% |
| EBITDA Margin | 23.61% | 20.73% | 16.74% |
| Gross Margin | 33.11% | -- | -- |
| Research & Development to Revenue | 0% | 0% | 0% |
These profitability metrics reflect Fox Corporation's efficient operational strategies, reinforcing its position in the competitive landscape.
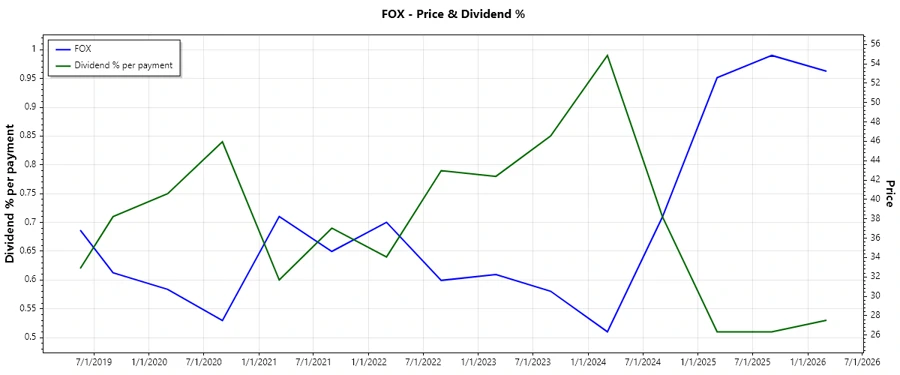
📉 Price Development
✅ Dividend Scoring System
| Category | Score | Representation |
|---|---|---|
| Dividend Yield | 3 | |
| Dividend Stability | 4 | |
| Dividend Growth | 3 | |
| Payout Ratio | 4 | |
| Financial Stability | 5 | |
| Dividend Continuity | 5 | |
| Cashflow Coverage | 4 | |
| Balance Sheet Quality | 5 |
Overall Score: 33/40
🗣️ Rating
Fox Corporation is a compelling choice for income investors, boasting a robust dividend policy supported by strong financial metrics and a prudent payout ratio. It maintains an impressive balance sheet and consistent dividend history, making it an attractive investment within the Communication Services sector.
Smart Data Insight
Master the Perfect Entry & Exit for this Stock
Don't leave your profits to chance. Historically, this stock follows specific seasonal patterns that institutional traders use to maximize returns.
- ✅ Identify the "Golden Buying Window"
- ✅ Avoid high-risk correction cycles
- ✅ Backtested data from the last 20+ years