June 22, 2026 a 09:03 am

FOXA: Trend and Support & Resistance Analysis - Fox Corporation
Fox Corporation (FOXA) demonstrates fluctuating trends influenced by its media operations, divided across news, sports, and entertainment. Recent market data reveals a shift in stock prices suggesting critical evaluation of support and resistance levels. Understanding these dynamics is essential for investors aiming to leverage opportunities within the media sector.
Trend Analysis
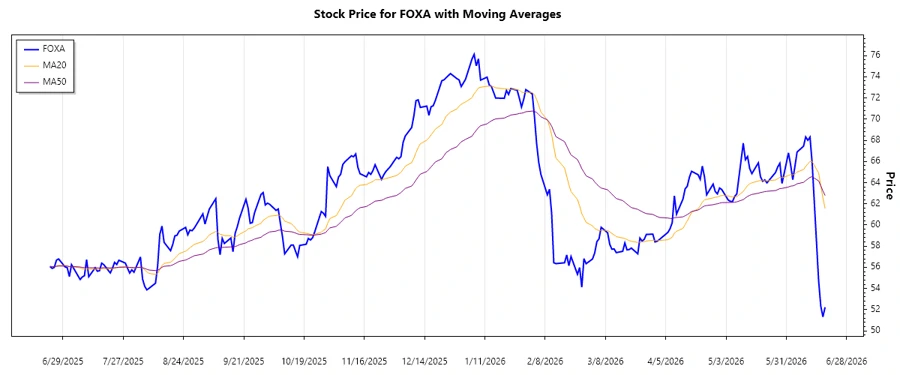
The analysis of the recent closing prices of FOXA stock indicates fluctuations with signs of a potential trend. Calculating the EMA20 and EMA50 helps determine the ongoing trend. Based on the technical indicators:
| Date | Closing Price | Trend |
|---|---|---|
| 2026-06-18 | 52.23 | ▼ |
| 2026-06-17 | 51.32 | ▼ |
| 2026-06-16 | 52.34 | ▼ |
| 2026-06-15 | 54.76 | ▼ |
| 2026-06-12 | 65.85 | ▲ |
| 2026-06-11 | 68.30 | ▲ |
| 2026-06-10 | 68.00 | ▲ |
The short-term analysis of FOXA suggests a ▼ downward trend primarily influenced by broader market conditions. This decline is punctuated by occasional upward spikes indicating potential volatility. The EMA20 falling below the EMA50 confirms the ▼ bearish outlook.
Support and Resistance
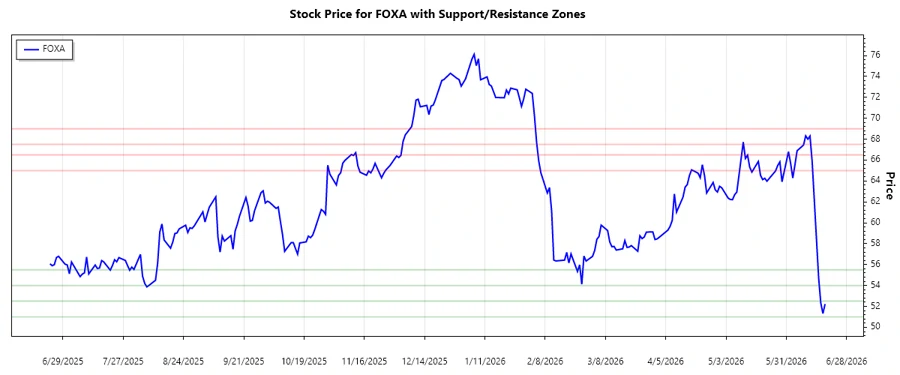
Identifying key support and resistance zones is vital for determining price stability areas.
| Zone Type | From | To |
|---|---|---|
| Support Zone 1 | 51.00 | 52.50 |
| Support Zone 2 | 54.00 | 55.50 |
| Resistance Zone 1 | 65.00 | 66.50 |
| Resistance Zone 2 | 67.50 | 69.00 |
The current price of FOXA is positioned near the lower support zones, suggesting a potential rebound if the broader market conditions support it. However, caution is advised, given the proximity to resistance levels which could limit the upside.
Conclusion
FOXA's stock is experiencing a ▼ downward trend, with significant resistance levels imminent. Investors should watch for market developments and potential reversals at support zones. While the media and entertainment sector offers long-term opportunities, current market volatility requires careful risk assessment. Analysts should closely monitor fluctuations and adjust strategies accordingly.
Smart Data Insight
Master the Perfect Entry & Exit for this Stock
Don't leave your profits to chance. Historically, this stock follows specific seasonal patterns that institutional traders use to maximize returns.
- ✅ Identify the "Golden Buying Window"
- ✅ Avoid high-risk correction cycles
- ✅ Backtested data from the last 20+ years