November 27, 2025 a 08:15 am


FOXA: Trend and Support & Resistance Analysis - Fox Corporation
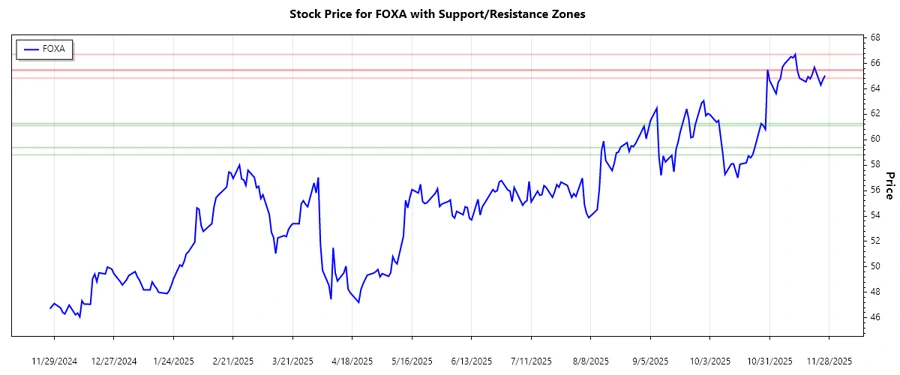
Fox Corporation (FOXA) has shown an overall bullish performance over the past months, helped by strong content production in its entertainment segments. However, recent price action suggests volatility with potential pullbacks. Technical analysis highlights key support and resistance zones that investors should monitor. The company's focus on expanding digital platforms will play a crucial role in sustaining long-term growth.
Trend Analysis
| Date | Close Price | Trend |
|---|---|---|
| 2025-11-26 | $65.05 | ▲ |
| 2025-11-25 | $64.73 | ▲ |
| 2025-11-24 | $64.30 | ▲ |
| 2025-11-21 | $65.69 | ▲ |
| 2025-11-20 | $65.14 | ▲ |
| 2025-11-19 | $64.78 | ▲ |
| 2025-11-18 | $64.96 | ▲ |
Analysis of recent trends indicates a strong bullish momentum as the EMA20 exceeds the EMA50, suggesting further upside potential. This signals a positive trend direction.
Support and Resistance
| Zone | Price Range | Type |
|---|---|---|
| Support 1 | $58.81 - $59.38 | ▼ |
| Support 2 | $61.11 - $61.27 | ▼ |
| Resistance 1 | $65.51 - $66.71 | ▲ |
| Resistance 2 | $64.84 - $65.44 | ▲ |
The current close price sits within the resistance zone, indicating potential for a breakout which would warrant close monitoring of price movement in the days ahead.
Conclusion
Fox Corporation's stock currently exhibits bullish characteristics, although the proximity to resistance zones presents potential challenges. Continued focus on content innovation and digital platform expansion are critical for sustaining growth. Investing now involves weighing the risk of potential retracement against the backdrop of ongoing upward trend momentum. Fundamentally, the company is poised to capitalize on its diverse revenue streams, which may boost future financial performance. Investors should remain vigilant and react to unfolding market conditions.