
August 08, 2025 a 03:15 am
FOXA: Trend and Support & Resistance Analysis - Fox Corporation
Fox Corporation, with its diversified portfolio including news, sports, and entertainment segments, shows resilience in its stock performance amid market volatility. With robust operations across cable networks and television segments, FOXA has maintained investor interest. However, its stock reveals a mixed trend, requiring close monitoring of support and resistance levels for future investment decisions.
Trend Analysis
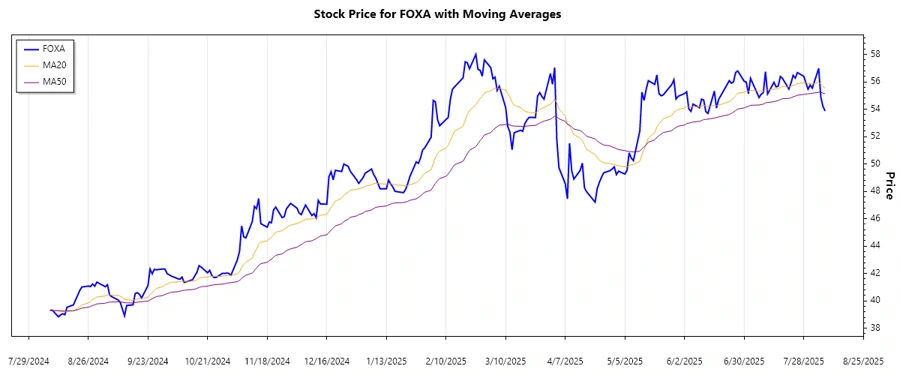
This section analyzes the recent trend observed in the FOXA stock over the last few days using EMA20 and EMA50.
| Date | Closing Price | Trend |
|---|---|---|
| 2025-08-07 | $53.87 | ▼ Abwärtstrend |
| 2025-08-06 | $54.20 | ▼ Abwärtstrend |
| 2025-08-05 | $54.89 | ▼ Abwärtstrend |
| 2025-08-04 | $56.98 | ▲ Aufwärtstrend |
| 2025-08-01 | $55.54 | ▲ Aufwärtstrend |
| 2025-07-31 | $55.76 | ▲ Aufwärtstrend |
| 2025-07-30 | $55.46 | ▲ Aufwärtstrend |
The recent market trend for FOXA stock shows a dominant ▼ Abwärtstrend in the most recent days, suggesting potential pressure on the stock. An EMA20 crossing below the EMA50 may indicate further declines.
Support- and Resistance
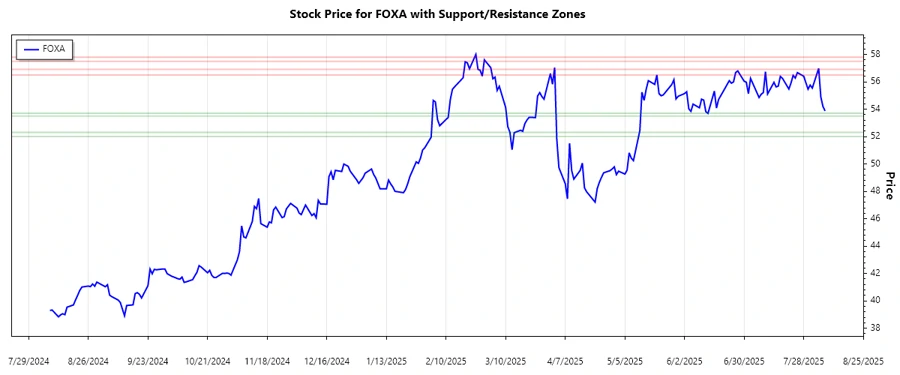
Two crucial support and resistance zones have been identified.
| Zone Type | From | To |
|---|---|---|
| Support 1 | $53.50 | $53.70 |
| Support 2 | $52.00 | $52.30 |
| Resistance 1 | $56.50 | $56.90 |
| Resistance 2 | $57.50 | $57.80 |
Currently, the stock trades between the identified Supports and Resistances, with the price hovering near support levels, potentially indicating a buying opportunity. However, if support fails, a further decline could be observed.
Conclusion
Fox Corporation's stock shows a current downward trend, with EMA indicators suggesting potential continuation. Key support levels could offer buying opportunities, though vigilance is advised as gains might be limited if resistance is not breached. Investors should consider current market conditions and potential catalysts within FOXA's operational segments before making investment decisions. The technical analysis highlights the necessity for vigilance in trading strategy development moving forward.
Smart Data Insight
Master the Perfect Entry & Exit for this Stock
Don't leave your profits to chance. Historically, this stock follows specific seasonal patterns that institutional traders use to maximize returns.
- ✅ Identify the "Golden Buying Window"
- ✅ Avoid high-risk correction cycles
- ✅ Backtested data from the last 20+ years