
July 19, 2026 a 06:44 am
FOXA: Fibonacci Analysis - Fox Corporation
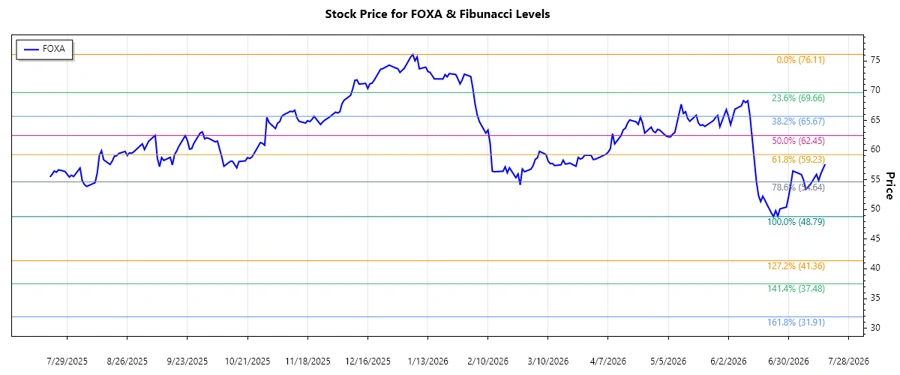
The Fox Corporation (FOXA) stock has shown a notable downward trend over the past months, primarily influenced by market dynamics and company-specific factors. Given its substantial role in the U.S. media landscape, its performance is of interest to market analysts and investors alike. Through technical analysis, Fibonacci retracement levels have been calculated to identify potential reversal and continuation points within this trend. This analysis will assist in understanding current price movements and predict future trends within a defined range.
Fibonacci Analysis
| Trend Start Date | Trend End Date | High Price | High Date | Low Price | Low Date | Fibonacci Levels |
|---|---|---|---|---|---|---|
| 2026-01-08 | 2026-07-17 | $76.11 | 2026-01-06 | $48.79 | 2026-06-23 |
|
Current price is within the 0.236 retracement zone, suggesting potential support. If the price continues to fall below this level, it might look to test lower Fibonacci retracement levels.
Conclusion
The analysis of Fox Corporation's stock indicates that it is currently exhibiting a downward trend. This offers a mix of opportunities and challenges. A break below the current Fibonacci level could suggest continued bearish momentum, while a rebound may indicate a period of consolidation or the start of a new upward trend. Analysts should remain wary of external market influences and company-specific news that may impact the stock's movement. In the long term, FOXA remains a key player in the media industry, with potential for recovery as market conditions stabilize.
Smart Data Insight
Master the Perfect Entry & Exit for this Stock
Don't leave your profits to chance. Historically, this stock follows specific seasonal patterns that institutional traders use to maximize returns.
- ✅ Identify the "Golden Buying Window"
- ✅ Avoid high-risk correction cycles
- ✅ Backtested data from the last 20+ years