May 09, 2026 a 06:44 am

FOXA: Fibonacci Analysis - Fox Corporation
Fox Corporation, a key player in the U.S. news, sports, and entertainment industries, has displayed significant stock volatility in recent months. Despite some fluctuations, the company has a strong foundation with its cable network programming and broad television segments. Investors may find opportunities as the market reacts to its diversified content offerings and strategic initiatives. Evaluating its recent pricing trends is crucial to making informed decisions.
Fibonacci Analysis
| Data Point | Value |
|---|---|
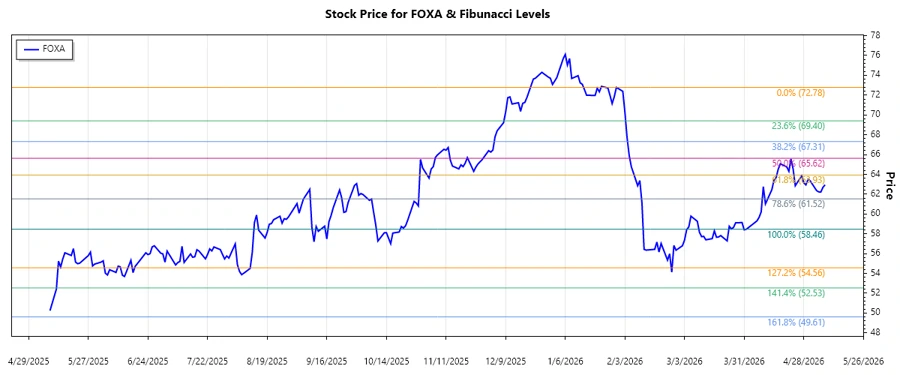
| Start Date of Trend | 2026-02-02 |
| End Date of Trend | 2026-05-08 |
| High Price | $72.78 |
| High Date | 2026-01-30 |
| Low Price | $58.46 |
| Low Date | 2026-04-01 |
| Current Price | $62.94 |
| Fibonacci Level | Price |
|---|---|
| 0.236 | $61.29 |
| 0.382 | $63.75 |
| 0.5 | $65.62 |
| 0.618 | $67.49 |
| 0.786 | $70.20 |
The current price of $62.94 is within the 0.236 Fibonacci retracement level.
This indicates the potential for the stock to gain support around this level, suggesting a possible upward movement, although it could face resistance at higher levels.
Conclusion
Fox Corporation's stock has shown a downward trend, finding significant support at the recent low of $58.46. As the current price approaches Fibonacci levels, investors should consider the potential for trend reversals or continued support. While breaking above these levels could propel the stock higher, failure to do so might mean further declines. Other market factors and the company's strategic maneuvers will also play crucial roles in its future trajectory. Monitoring industry trends is vital for evaluating both opportunities and risks moving forward.
Smart Data Insight
Master the Perfect Entry & Exit for this Stock
Don't leave your profits to chance. Historically, this stock follows specific seasonal patterns that institutional traders use to maximize returns.
- ✅ Identify the "Golden Buying Window"
- ✅ Avoid high-risk correction cycles
- ✅ Backtested data from the last 20+ years