
June 05, 2026 a 03:30 pm

FOXA: Dividend Analysis - Fox Corporation
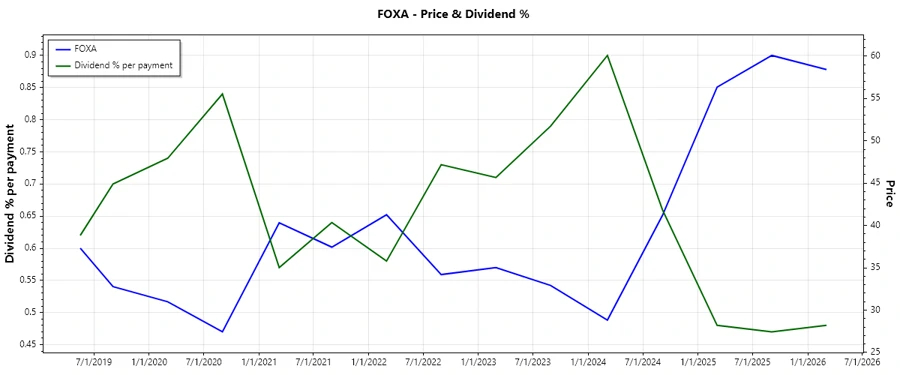
Fox Corporation demonstrates a consistent dividend policy with a yield slightly below 1%. Its commitment to shareholders is evident with increasing dividends over the past years. The company's payout ratios suggest a conservative approach to dividend distribution, supporting financial stability. Insights into future dividend growth and corporate strategies are crucial for potential investors. Despite a modest history, dividend growth has been steady, showing potential for long-term investor returns.
📊 Overview
A detailed examination of Fox Corporation's dividend metrics reflects its standing in the media industry. The company's current yield and payout ratios are essential for assessing its attractiveness to dividend-seeking investors.
| Indicator | Value |
|---|---|
| Sector | Media |
| Dividend yield | 0.96% |
| Current dividend per share | 0.60 USD |
| Dividend history | 8 years |
| Last cut or suspension | None |
🗣️ Dividend History
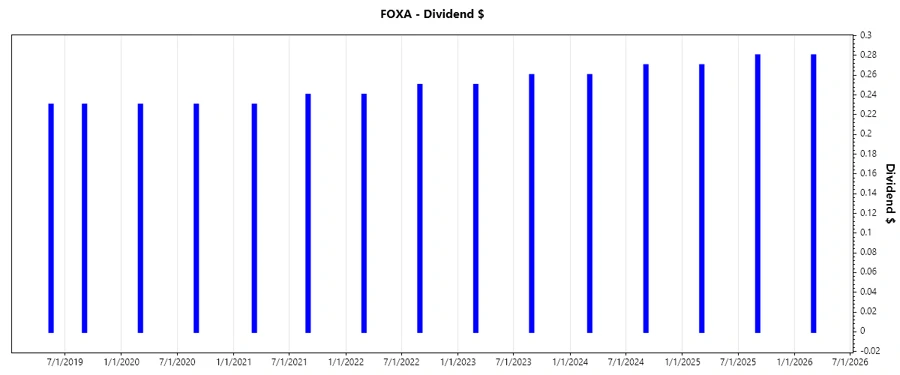
Understanding the history of dividend payments is critical to evaluate the company's consistency in returning capital to its shareholders. Fox Corporation's ability to maintain its dividend payments through various market conditions is a testament to its robust business model.
| Year | Dividend per Share (USD) |
|---|---|
| 2026 | 0.28 |
| 2025 | 0.55 |
| 2024 | 0.53 |
| 2023 | 0.51 |
| 2022 | 0.49 |
📈 Dividend Growth
Dividend growth is a critical measure of the company's ability to increase shareholder value over time. Growth in dividends reflects underlying earnings growth and management's commitment to shareholder returns.
| Time | Growth |
|---|---|
| 3 years | 3.93% |
| 5 years | 3.64% |
The average dividend growth is 3.64% over 5 years. This shows moderate but steady dividend growth.
📉 Payout Ratio
A company’s payout ratio indicates how much of its earnings are paid out in dividends. A reasonable payout ratio suggests sustainable dividend payments alongside reinvestment flexibility.
| Key Figure | Ratio |
|---|---|
| EPS-based | 14.89% |
| Free cash flow-based | 11.16% |
The low EPS payout ratio of 14.89% and FCF payout ratio of 11.16% suggest that Fox Corporation retains sufficient earnings to reinvest while still rewarding its shareholders, indicating a balanced capital allocation strategy.
📊 Cashflow & Capital Efficiency
The evaluation of cash flow metrics and capital efficiency provides insights into the firm’s operational efficiency and ability to generate returns from its investments.
| Year | 2025 | 2024 | 2023 |
|---|---|---|---|
| Free Cash Flow Yield | 11.58% | 9.17% | 8.02% |
| Earnings Yield | 8.76% | 9.20% | 6.89% |
| CAPEX to Operating Cash Flow | 9.76% | 18.75% | 19.83% |
| Stock-based Compensation to Revenue | 0.83% | 0.64% | 0.50% |
| Free Cash Flow / Operating Cash Flow Ratio | 90.04% | 81.25% | 80.17% |
The company's free cash flow yield and capital efficiency ratios underline its capability to generate and maintain robust cash flows, complementing its dividend payout strategy.
📊 Balance Sheet & Leverage Analysis
A strong balance sheet indicates financial stability and provides the flexibility to undertake new investments without jeopardizing the firm's liquidity position.
| Year | 2025 | 2024 | 2023 |
|---|---|---|---|
| Debt-to-Equity | 0.62 | 0.76 | 0.79 |
| Debt-to-Assets | 0.32 | 0.37 | 0.38 |
| Debt-to-Capital | 0.38 | 0.43 | 0.44 |
| Net Debt to EBITDA | 0.55 | 1.32 | 1.58 |
| Current Ratio | 2.90 | 2.54 | 1.93 |
| Quick Ratio | 2.76 | 2.33 | 1.78 |
| Financial Leverage | 1.93 | 2.05 | 2.11 |
The leverage ratios depict Fox Corporation's prudent management of debt, balancing risk and growth potential, further reinforcing its dividend payment capacity.
📊 Fundamental Strength & Profitability
Profitability ratios reflect Fox Corporation’s efficiency in generating profits relative to its equity and assets, central to supporting dividend payments.
| Year | 2025 | 2024 | 2023 |
|---|---|---|---|
| Return on Equity | 18.92% | 14.01% | 11.94% |
| Return on Assets | 9.76% | 6.83% | 5.67% |
| Margins: Net | 13.88% | 10.74% | 8.31% |
| EBIT Margin | 21.25% | 17.95% | 13.98% |
| EBITDA Margin | 23.61% | 20.73% | 16.74% |
| Gross Margin | 33.11% | 100% | 100% |
| R&D to Revenue | 0.00% | 0.00% | 0.00% |
The solid return on equity and asset-based returns reflect the company's strength in utilizing its assets efficiently to drive earnings, supporting ongoing dividend payments.
📊 Price Development
🎯 Dividend Scoring System
| Criterion | Score | Evaluation |
|---|---|---|
| Dividend yield | 3 | |
| Dividend Stability | 4 | |
| Dividend growth | 3 | |
| Payout ratio | 5 | |
| Financial stability | 4 | |
| Dividend continuity | 4 | |
| Cashflow Coverage | 4 | |
| Balance Sheet Quality | 4 |
Total Score: 31/40
✅ Rating
Fox Corporation presents a solid investment opportunity for dividend-focused portfolios. The company's prudent payout ratio and consistent dividend history highlight a sustained capacity to return value to shareholders. While the dividend yield is moderate, continued growth and robust financials underscore the attractiveness of the stock. Investors seeking stable returns with some growth potential may find Fox Corporation a suitable addition to their portfolio.
Smart Data Insight
Master the Perfect Entry & Exit for this Stock
Don't leave your profits to chance. Historically, this stock follows specific seasonal patterns that institutional traders use to maximize returns.
- ✅ Identify the "Golden Buying Window"
- ✅ Avoid high-risk correction cycles
- ✅ Backtested data from the last 20+ years