September 21, 2025 a 12:47 pm
FOXA: Dividend Analysis - Fox Corporation
Fox Corporation demonstrates a steady if modest dividend profile, with consistent payout history that spans over seven years without significant cuts. However, its dividend yield of 0.91% may appear underwhelming compared to industry peers. Additionally, the company's commitment to maintaining a low payout ratio suggests its dividends are well-covered by earnings, signaling responsible fiscal management.
📊 Overview
The following table provides a snapshot of Fox Corporation’s dividend-related metrics and industry sector classification. This data emphasizes the company's stability in maintaining its dividend payments unwavering for several years, aligning with the broader strategic goals in the Media sector.
| Metric | Value |
|---|---|
| Sector | Media |
| Dividend yield | 0.91% |
| Current dividend per share | 0.60 USD |
| Dividend history | 7 years |
| Last cut or suspension | None |
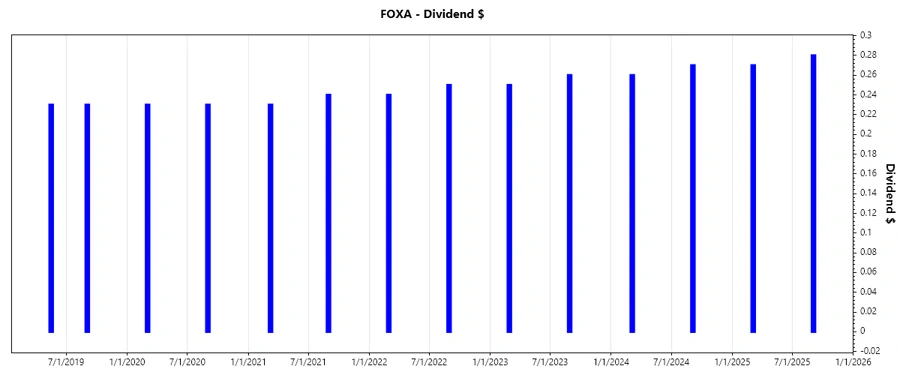
📈 Dividend History
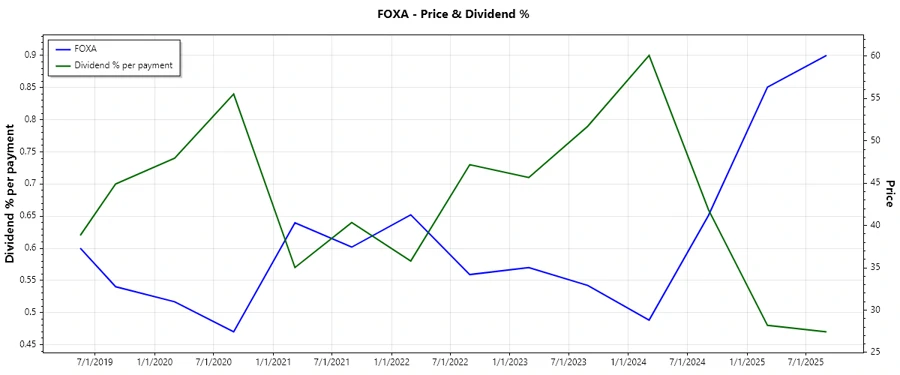
Fox Corporation exhibits a stable dividend history, crucial for potential investors seeking income stability. This consistency can be an attractive feature for conservative investors who prioritize recurring income over capital appreciation.
| Year | Dividend Per Share (USD) |
|---|---|
| 2025 | 0.55 |
| 2024 | 0.53 |
| 2023 | 0.51 |
| 2022 | 0.49 |
| 2021 | 0.47 |
📈 Dividend Growth
The company displays modest dividend growth, illustrating gradual but steady enhancements to shareholder returns. This incremental growth is pivotal for long-term investment horizons, signifying potential increases in income over time.
| Time | Growth |
|---|---|
| 3 years | 4.09% |
| 5 years | 2.87% |
The average dividend growth is 2.87% over 5 years. This shows moderate but steady dividend growth.
📊 Payout Ratio
The payout ratio is a critical determinant of dividend sustainability. By maintaining low payout ratios, both earnings-based and free cash flow-based, the company ensures dividends are well-covered, even during fluctuations in cyclical revenues or market downturns.
| Key figure | Ratio |
|---|---|
| EPS-based | 12.13% |
| Free cash flow-based | 8.94% |
With EPS at 12.13% and FCF at 8.94%, these ratios indicate strong dividend coverage, affirming fiscal robustness and shareholder assurance.
Cashflow & Capital Efficiency
Evaluating cash flows alongside capital efficiency metrics provides deeper insights into the operational health of the enterprise. These indicators are crucial for identifying stability in free cash generation and capital allocation effectiveness.
| Year | 2025 | 2024 | 2023 |
|---|---|---|---|
| Free Cash Flow Yield | 11.58% | 9.17% | 8.02% |
| Earnings Yield | 8.76% | 9.20% | 6.89% |
| CAPEX to Operating Cash Flow | 9.96% | 18.75% | 19.83% |
| Stock-based Compensation to Revenue | 0.83% | 0.64% | 0.50% |
| Free Cash Flow / Operating Cash Flow Ratio | 90.04% | 81.25% | 80.17% |
The robust cash flow yield and efficient CAPEX spending elucidate the company's strong capability to finance dividends and reinvest in growth without compromising its liquidity position.
Balance Sheet & Leverage Analysis
Assessing balance sheet strength through leverage ratios and liquidity metrics offers an understanding of the company's solvency and financial resilience. These factors are pivotal for ensuring ongoing operational funding and mitigating financial distress risks.
| Year | 2025 | 2024 | 2023 |
|---|---|---|---|
| Debt-to-Equity | 62.41% | 76.09% | 79.08% |
| Debt-to-Assets | 32.18% | 37.10% | 37.53% |
| Debt-to-Capital | 38.43% | 43.21% | 44.16% |
| Net Debt to EBITDA | 0.55 | 1.32 | 1.58 |
| Current Ratio | 2.91 | 2.54 | 1.93 |
| Quick Ratio | 2.76 | 2.33 | 1.78 |
| Financial Leverage | 1.94 | 2.05 | 2.11 |
The company's balance sheet reflects robust liquidity ratios and moderate leverage, ensuring it remains well-positioned to meet its short and long-term obligations.
Fundamental Strength & Profitability
Tracking profitability metrics such as return on equity and asset margins provides insight into the company's ability to generate returns on invested capital. These indicators are fundamental for gauging operational efficiency.
| Year | 2025 | 2024 | 2023 |
|---|---|---|---|
| Return on Equity | 19.57% | 14.01% | 11.94% |
| Return on Assets | 9.76% | 6.83% | 5.67% |
| Net Margin | 13.88% | 10.74% | 8.31% |
| EBIT Margin | 21.25% | 17.95% | 13.98% |
| EBITDA Margin | 23.61% | 20.73% | 16.74% |
| Gross Margin | 100% | 100% | 100% |
| Research & Development to Revenue | 0% | 0% | 0% |
The company's sustained profitability and diverse margin profiles accentuate its efficiency in capital utilization, translating to higher shareholder value.
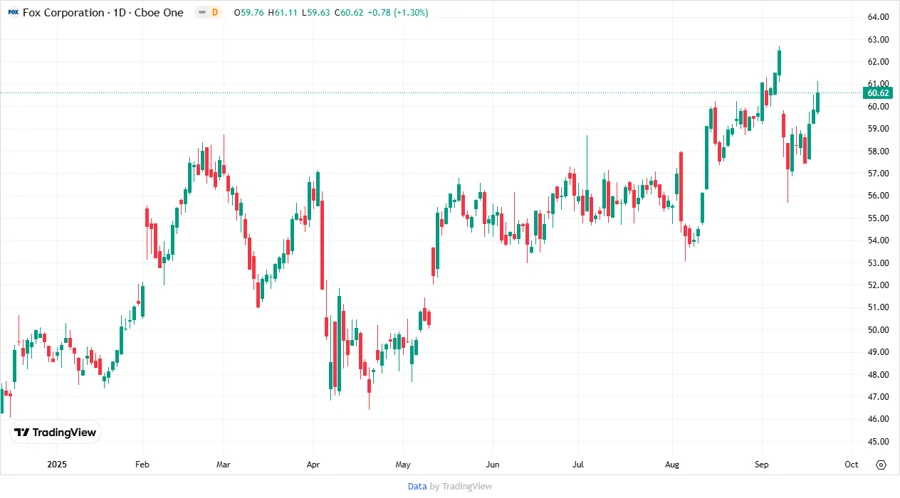
⚖️ Price Development
🏆 Dividend Scoring System
This scoring system provides a comprehensive evaluation of Fox Corporation's dividend quality across multiple key performance indicators.
| Criteria | Score | Score Bar |
|---|---|---|
| Dividend yield | 2 | |
| Dividend Stability | 4 | |
| Dividend growth | 3 | |
| Payout ratio | 5 | |
| Financial stability | 4 | |
| Dividend continuity | 5 | |
| Cashflow Coverage | 5 | |
| Balance Sheet Quality | 4 |
Total Score: 32/40
📤 Rating
Fox Corporation maintains a strong and reliable dividend package suitable for investors seeking stability with modest growth. The attractive payout ratio and financial stability make it a viable choice for income-focused portfolios, though the relatively low dividend yield may not suit all income investors. Overall, the company presents a dependable opportunity, evident by its consistent dividend history and robust financial strength.