August 08, 2025 a 03:31 am

FOXA: Dividend Analysis - Fox Corporation
Fox Corporation presents a moderate dividend yield combined with stable financial metrics, reflecting its robust position in the media sector. Despite recent financial market volatility, the corporation maintains a commendable payout ratio, suggesting prudent fiscal management. This analysis aims to dissect the company’s dividend profile and assess its future potential based on recent trends.
📊 Overview
Fox Corporation, a key player in the Communications sector, demonstrates a conservative yet stable approach to dividend distribution. The company's commitment to maintaining shareholder value is evident in its dividend history.
| Sector | Dividend Yield | Current Dividend per Share | Dividend History | Last Cut or Suspension |
|---|---|---|---|---|
| Communications | 1.02% | 0.60 USD | 7 years | None |
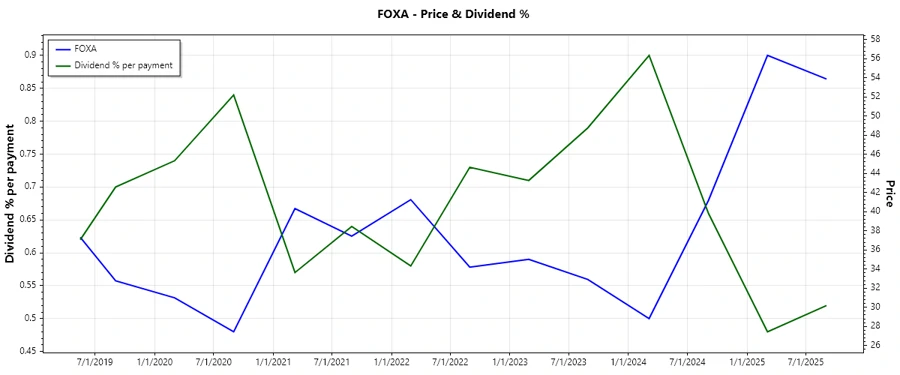
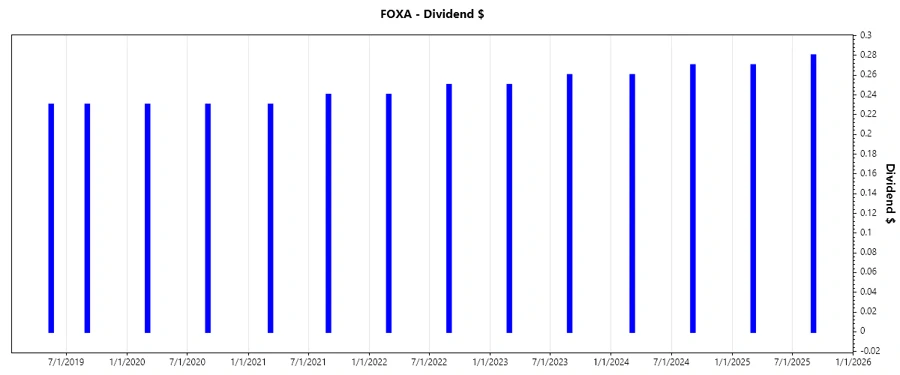
🗣️ Dividend History
An analysis of Fox Corporation’s dividend payouts reveals a consistent upward trajectory over the past five years. Such a trend is indicative of the company's profitability and stable cash flows, factors critical for sustainable dividend payments to investors.
| Year | Dividend per Share (USD) |
|---|---|
| 2025 | 0.55 |
| 2024 | 0.53 |
| 2023 | 0.51 |
| 2022 | 0.49 |
| 2021 | 0.47 |
📈 Dividend Growth
The dividend growth rates for Fox Corporation over the past five years reflect a trend of sustained growth, albeit at a moderate pace, which reinforces investor confidence and supports long-term value retention.
| Time | Growth |
|---|---|
| 3 years | 4.09% |
| 5 years | 2.87% |
The average dividend growth is 2.87% over 5 years. This shows moderate but steady dividend growth.
🏦 Payout Ratio
The payout ratios, both based on EPS and Free Cash Flow, suggest a disciplined approach to dividend payment. A lower payout ratio typically indicates that the company has room to maintain or grow dividends, even in challenging economic environments.
| Key Figure | Payout Ratio |
|---|---|
| EPS-based | 12.13% |
| Free cash flow-based | 10.81% |
The low EPS payout ratio of 12.13% combined with a free cash flow payout ratio of 10.81% highlights a strong position for continued dividend payments without straining fiscal resources.
💸 Cashflow & Capital Efficiency
A comprehensive examination of cash flow and capital efficiency metrics is essential to determine Fox Corporation's abilities to sustain dividend payments without sacrificing growth capital allocation. The following data provides insights into capital efficiency over the years.
| Year | 2025 | 2024 | 2023 |
|---|---|---|---|
| Free Cash Flow Yield | 12.87% | 9.17% | 8.02% |
| Earnings Yield | 8.76% | 9.20% | 6.89% |
| CAPEX to Operating Cash Flow | 0% | 18.75% | 19.83% |
| Stock-based Compensation to Revenue | 0.83% | 0.64% | 0.50% |
| Free Cash Flow / Operating Cash Flow Ratio | 100% | 81.25% | 80.17% |
Fox Corporation displays a robust cash flow generation capability, reflected in a high free cash flow yield and a controlled CAPEX to Operating Cash Flow, highlighting efficient capital allocation and a foundation for stable dividends.
📉 Balance Sheet & Leverage Analysis
Analyzing the balance sheet components illustrates Fox Corporation's financial stability and its use of leverage, which are pivotal in stress endurance and financial stability over long terms.
| Year | 2024 | 2023 |
|---|---|---|
| Debt-to-Equity | 76.09% | 69.47% |
| Debt-to-Assets | 37.10% | 32.97% |
| Debt-to-Capital | 43.21% | 40.99% |
| Net Debt to EBITDA | 1.32 | 1.18 |
| Current Ratio | 2.54 | 1.93 |
| Quick Ratio | 2.33 | 1.78 |
| Financial Leverage | 2.05 | 2.11 |
Fox Corporation demonstrates a sound leverage strategy with favorable debt ratios, indicating efficient capital structure policies and a robust solvency position that supports its dividend strategies.
✅ Fundamental Strength & Profitability
Evaluating profitability and returns gives crucial insights into the effectiveness of a company's operations and its ability to sustain dividends from core business profits.
| Year | 2024 | 2023 |
|---|---|---|
| Return on Equity | 14.01% | 11.94% |
| Return on Assets | 6.83% | 5.67% |
| Net Margin | 10.74% | 8.31% |
| EBIT Margin | 17.95% | 13.98% |
| EBITDA Margin | 20.73% | 16.74% |
| Gross Margin | 100% | 32.27% |
| R&D to Revenue | 0% | 0% |
High profitability and return metrics underline Fox Corporation’s operational efficiency, with margins indicating strong pricing power and cost control that enhance dividend sustainability.
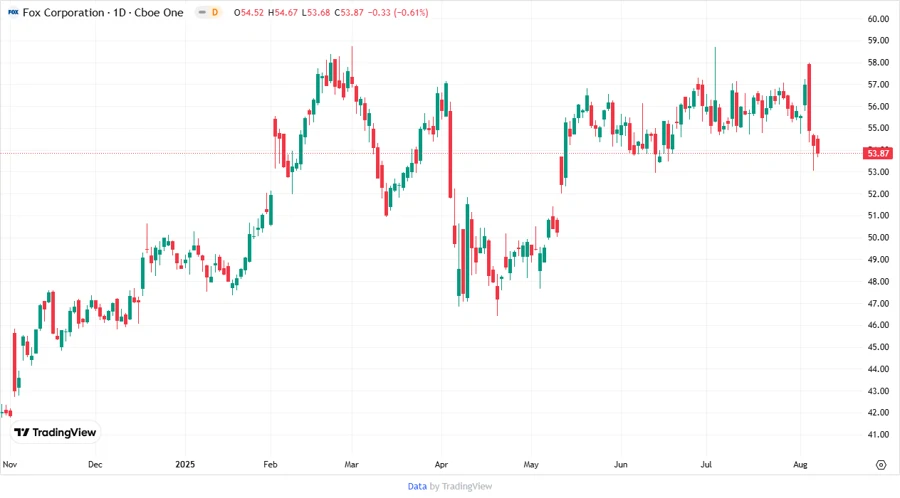
📈 Price Development
🔍 Dividend Scoring System
| Criterion | Description | Score |
|---|---|---|
| Dividend yield | 2/5 | |
| Dividend Stability | 4/5 | |
| Dividend growth | 3/5 | |
| Payout ratio | 5/5 | |
| Financial stability | 4/5 | |
| Dividend continuity | 5/5 | |
| Cashflow Coverage | 4/5 | |
| Balance Sheet Quality | 4/5 |
Total Score: 31/40
📋 Rating
Fox Corporation maintains a healthy financial profile with significant resilience against market fluctuations, underscored by strong dividend management and fiscal prudence. Its blend of moderate growth and stable returns positions it as an attractive option for long-term income-focused investors.
Smart Data Insight
Master the Perfect Entry & Exit for this Stock
Don't leave your profits to chance. Historically, this stock follows specific seasonal patterns that institutional traders use to maximize returns.
- ✅ Identify the "Golden Buying Window"
- ✅ Avoid high-risk correction cycles
- ✅ Backtested data from the last 20+ years