September 26, 2025 a 02:04 pm
FI: Trend and Support & Resistance Analysis - Fiserv, Inc.
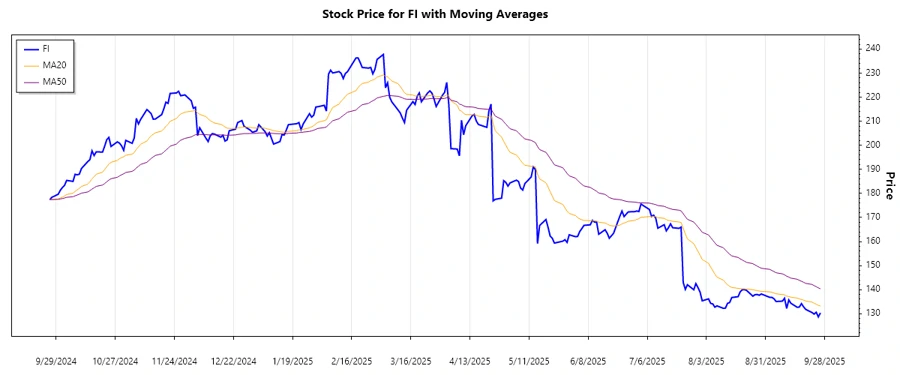
Fiserv, Inc. has shown significant fluctuations in its stock performance over the past months, influenced by varying business segments and market conditions. Recently, the stock seems to have entered a downwards trajectory, characterized by diminishing closing prices. Analyzing the exponential moving averages (EMAs) clarifies this prevailing trend and helps us identify possible support and resistance zones that could affect future stock movements.
Trend Analysis
| Date | Close Price | Trend |
|---|---|---|
| 2025-09-26 | 130.32 | ▼ Down |
| 2025-09-25 | 128.66 | ▼ Down |
| 2025-09-24 | 130.59 | ▼ Down |
| 2025-09-23 | 129.82 | ▼ Down |
| 2025-09-22 | 130.48 | ▼ Down |
| 2025-09-19 | 131.80 | ▼ Down |
| 2025-09-18 | 132.87 | ▼ Down |
Based on the calculations of EMA20 and EMA50, the current trend indicates a consistent decline in stock price, marking a downward trend. This is reflected in the dominance of bearish candles and lower lows evident in recent trading days.
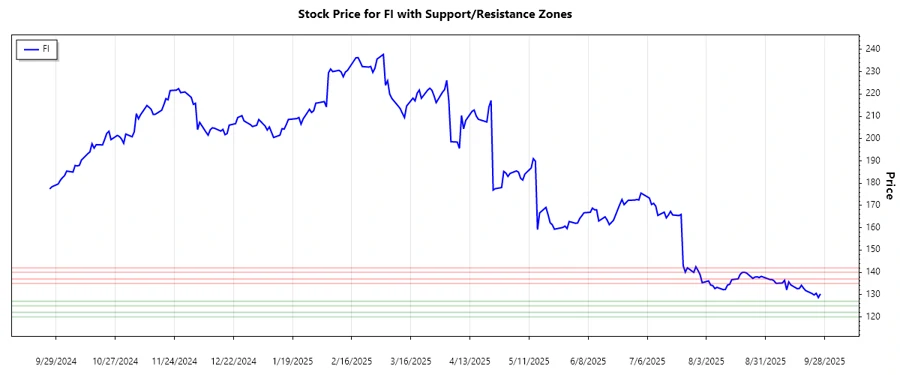
Support and Resistance
| Zone Type | From | To |
|---|---|---|
| Resistance Zone 1 | 140.00 | 142.00 |
| Resistance Zone 2 | 135.00 | 137.00 |
| Support Zone 1 | 125.00 | 127.00 |
| Support Zone 2 | 120.00 | 122.00 |
The current price is approaching the lower support zone indicating potential buying interest around these levels. However, if the price fails to hold, more downside could be expected towards the next support zone.
Conclusion
The technical analysis of Fiserv, Inc. shows a strong ongoing downtrend with clearly defined support and resistance levels. Considering the sharp price movements and EMA indicators, traders should remain cautious. The stock's closure within these zones could signify potential pivotal points. Upcoming financial results and market sentiment could alter this trajectory, providing opportunities or risks for trading strategies.