September 14, 2025 a 06:45 am

FI: Fibonacci Analysis - Fiserv, Inc.
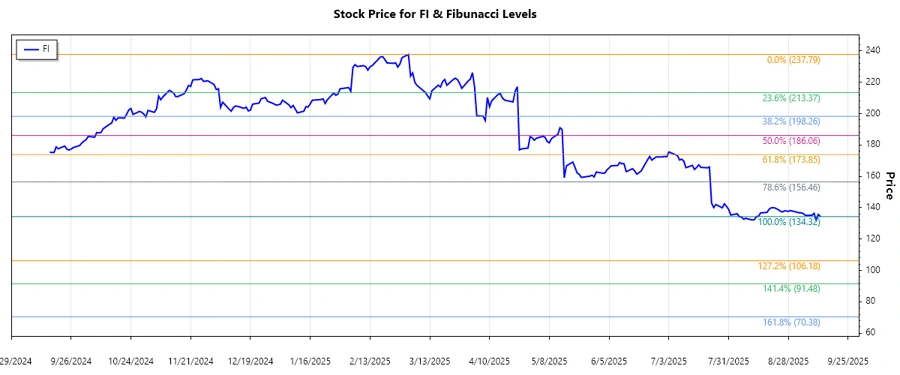
The analysis of Fiserv, Inc. stock reveals a dominant downtrend from April 2025 to September 2025. The stock peaked in February but started losing momentum, resulting in gradual price diminishment. Considering its business capabilities in payment and financial services technology, missed growth opportunities during this period shape an interesting pivot for potential recovery scenarios.
Fibonacci Analysis
| Trend Start Date | Trend End Date | High Price (Date) | Low Price (Date) |
|---|---|---|---|
| 2025-02-28 | 2025-09-12 | $237.79 (2025-03-03) | $134.32 (2025-09-12) |
| Fibonacci Level | Price Level |
|---|---|
| 0.236 | $159.79 |
| 0.382 | $173.27 |
| 0.500 | $186.06 |
| 0.618 | $198.85 |
| 0.786 | $215.11 |
Currently, the stock is in a retracement zone near the 0.236 level, suggesting a possible short-term support before testing further support levels. A breach below this level could imply a continuation of the downward momentum.
The analysis indicates potential support around the 0.236 Fibonacci level, acting as a barrier for further declines. Should the price rebound, a move towards the 0.382 level is feasible.
Conclusion
Fiserv, Inc.'s stock is experiencing a notable downtrend with potential opportunities for stabilization if the 0.236 Fibonacci level holds as support. Even though the company's technology and financial service offerings remain robust, market sentiment and macroeconomic factors may play intricate roles in its short to medium-term recovery. Analysts should cautiously monitor the stock for any bullish reversals, while acknowledging the risk of further drops. Technical indicators suggest observing consolidation stages that may lead to a pivot in stock behavior. Long-term investors may find entry points appealing, pending a solid confirmation of enduring support.
Smart Data Insight
Master the Perfect Entry & Exit for this Stock
Don't leave your profits to chance. Historically, this stock follows specific seasonal patterns that institutional traders use to maximize returns.
- ✅ Identify the "Golden Buying Window"
- ✅ Avoid high-risk correction cycles
- ✅ Backtested data from the last 20+ years