
July 22, 2026 a 11:31 am

FIX: Dividend Analysis - Comfort Systems USA, Inc.
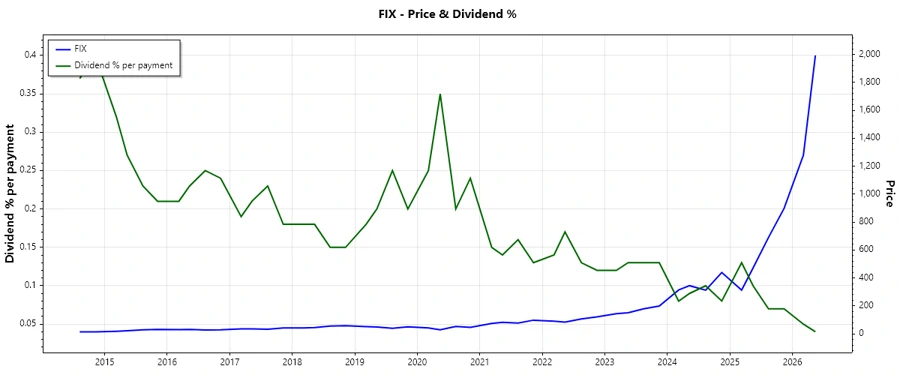
Comfort Systems USA, Inc. showcases a solid record in maintaining and growing its dividends, evident through its 22-year dividend history. This reflects the company's robust cash flow capabilities and its commitment to returning value to shareholders. While the recent dividend yield stands at a relatively modest 0.13%, the continuous dividend growth underscores potential for future increases, compensating investors looking for long-term income growth.
📊 Overview
Comfort Systems USA, Inc. operates within a cyclical sector and aims to provide consistent dividend payouts with a strong historical backdrop.
| Metric | Value |
|---|---|
| Sector | Industrial |
| Dividend Yield | 0.13 % |
| Current Dividend per Share | 1.95 USD |
| Dividend History | 22 years |
| Last Cut or Suspension | None |
📈 Dividend History
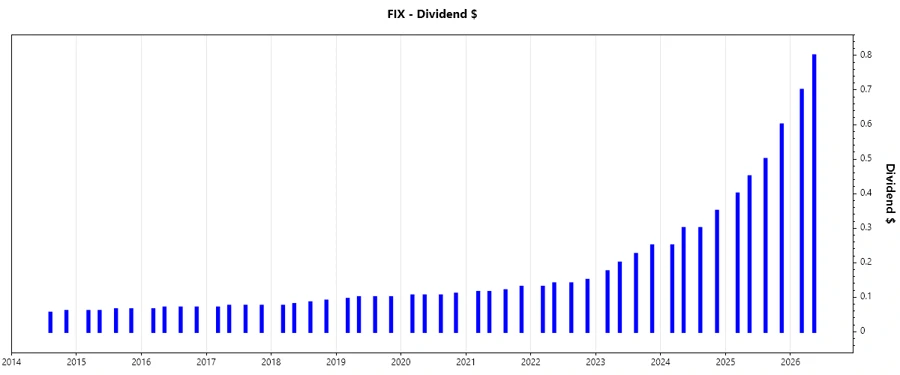
The company's resilient dividend history over 22 years is a testament to its stable cash flow and management strategy. This track record can provide assurance to potential investors about the reliability of dividend income.
| Year | Dividend per Share |
|---|---|
| 2026 | 1.50 USD |
| 2025 | 1.95 USD |
| 2024 | 1.20 USD |
| 2023 | 0.85 USD |
| 2022 | 0.56 USD |
📊 Dividend Growth
Comfort Systems USA, Inc. demonstrates a moderate but consistent growth in dividends, crucial for investors focused on long-term income enhancement.
| Time | Growth |
|---|---|
| 3 years | 51.57 % |
| 5 years | 35.62 % |
The average dividend growth is 35.62 % over 5 years. This shows moderate but steady dividend growth.
⚠️ Payout Ratio
Payout ratios are instrumental in assessing a company's financial health and capacity to maintain dividends. A low payout ratio might indicate potential for dividend growth or reinvestment in the business.
| Key figure | Ratio |
|---|---|
| EPS-based | 5.60 % |
| Free cash flow-based | 4.96 % |
With an EPS payout ratio of 5.60 % and an FCF payout ratio of 4.96 %, Comfort Systems showcases its fiscal discipline and room to increase future payouts, supporting its dividends safely within earnings and cash flow structures.
📊 Cashflow & Capital Efficiency
Cash flow analysis provides insights into how effectively a company converts its revenue into cash, a crucial factor for sustaining dividend payouts and funding growth.
| Metric | 2023 | 2024 | 2025 |
|---|---|---|---|
| Free Cash Flow Yield | 0.0739 | 0.0487 | 0.0313 |
| Earnings Yield | 0.0439 | 0.0345 | 0.0310 |
| CAPEX to Operating Cash Flow | 0.1483 | 0.1308 | 0.1306 |
| Stock-based Compensation to Revenue | 0.0025 | 0.0024 | 0.0024 |
| Free Cash Flow / Operating Cash Flow Ratio | 0.8517 | 0.8692 | 0.8694 |
The stable cash flow management over the past years reveals sound fiscal execution. The calculated returns confirm the potential for sustainable capital reinvestment and dividend distributions.
📊 Balance Sheet & Leverage Analysis
Understanding the company's leverage through its balance sheet enables investors to assess debt levels and its capacity for obliged financial commitments.
| Metric | 2023 | 2024 | 2025 |
|---|---|---|---|
| Debt-to-Equity | 0.2009 | 0.1810 | 0.3210 |
| Debt-to-Assets | 0.0777 | 0.0655 | 0.1220 |
| Debt-to-Capital | 0.1673 | 0.1533 | 0.2430 |
| Net Debt to EBITDA | 0.1079 | -0.2954 | -0.1357 |
| Current Ratio | 1.1103 | 1.0803 | 1.2112 |
| Quick Ratio | 1.0722 | 1.0574 | 1.1864 |
| Financial Leverage | 2.5869 | 2.7636 | 2.6304 |
The company's consistent ability to manage debt, along with strong quick and current ratios, showcases substantial financial flexibility and liability coverage relative to its equity base.
📊 Fundamental Strength & Profitability
Analyzing metrics such as Return on Equity and Profit Margins provides an insight into the company's operational efficiency and profitability capabilities.
| Metric | 2023 | 2024 | 2025 |
|---|---|---|---|
| Return on Equity | 25.31 % | 30.65 % | 41.76 % |
| Return on Assets | 9.78 % | 11.09 % | 15.88 % |
| Margins: Net | 6.21 % | 7.43 % | 11.23 % |
| Margins: EBIT | 7.63 % | 9.56 % | 14.31 % |
| Margins: EBITDA | 9.19 % | 11.63 % | 15.87 % |
| Margins: Gross | 19.02 % | 21.01 % | 24.13 % |
| Research & Development to Revenue | 0 % | 0 % | 0 % |
The marked improvements in ROE and other profitability margins underline Comfort Systems’ operational leverage and adept cost management translating into robust profitability.
📊 Price Development
📉 Dividend Scoring System
| Category | Score | Indicator |
|---|---|---|
| Dividend Yield | 2 | |
| Dividend Stability | 5 | |
| Dividend Growth | 4 | |
| Payout Ratio | 5 | |
| Financial Stability | 4 | |
| Dividend Continuity | 5 | |
| Cashflow Coverage | 4 | |
| Balance Sheet Quality | 4 |
Total Score: 33/40
✅ Rating
Comfort Systems USA, Inc. presents a stable investment opportunity with a firm foundation in dividend consistency and growth potential. This stock is ideal for investors seeking long-term income growth coupled with financial reliability. With a dividend score of 33/40 and a commendable historical performance, Comfort Systems USA maintains a positive outlook for future dividend sustainability.
Smart Data Insight
Master the Perfect Entry & Exit for this Stock
Don't leave your profits to chance. Historically, this stock follows specific seasonal patterns that institutional traders use to maximize returns.
- ✅ Identify the "Golden Buying Window"
- ✅ Avoid high-risk correction cycles
- ✅ Backtested data from the last 20+ years