May 10, 2026 a 12:46 pm
FIX: Dividend Analysis - Comfort Systems USA, Inc.
Comfort Systems USA, Inc. demonstrates a resilient and growth-oriented dividend profile, making it a noteworthy choice for income-focused investors. With over two decades of consistent dividend history and a moderate yet steady dividend growth trajectory, it positions itself as a stable income provider. However, investors must be aware of its relatively low current dividend yield. The company maintains a robust financial structure, reflected in its low payout ratios, which indicate a conservative approach towards dividend distribution.
📊 Overview
Comfort Systems USA, Inc. operates within the sector, specializing in mechanical, electrical, and plumbing services. Despite a modest dividend yield of 0.13%, the company’s dividend history spans 22 years, underscoring solid dividend reliability. The absence of any recent dividend cuts further strengthens investor confidence.
| Category | Details |
|---|---|
| Sector | Construction & Engineering |
| Dividend yield | 0.13 % |
| Current dividend per share | 1.95 USD |
| Dividend history | 22 years |
| Last cut or suspension | None |
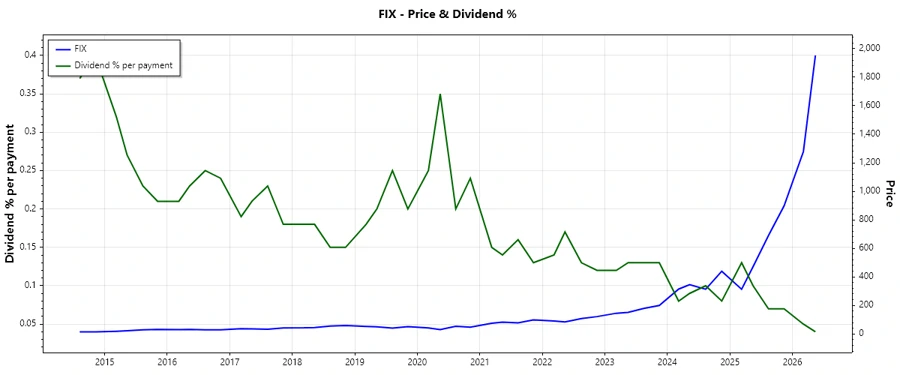
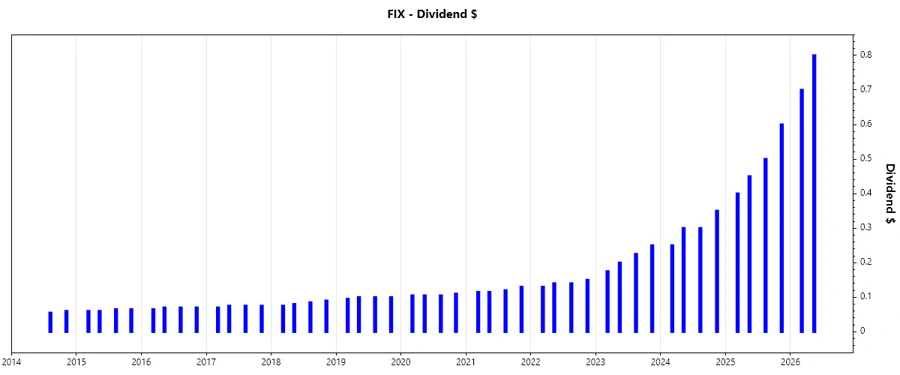
📈 Dividend History
The company's dividend history is a testament to its stability and commitment to shareholder returns. The consistent increase over the years highlights the confidence in its business model.
| Year | Dividend per Share (USD) |
|---|---|
| 2026 | 1.5 |
| 2025 | 1.95 |
| 2024 | 1.20 |
| 2023 | 0.850 |
| 2022 | 0.56 |
🗣️ Dividend Growth
Analyzing its dividend growth offers insights into future income potential. Over the past five years, the company achieved a 35.62% growth, pointing to its long-term growth prospects.
| Time | Growth |
|---|---|
| 3 years | 51.57 % |
| 5 years | 35.62 % |
The average dividend growth is 35.62% over 5 years. This shows moderate but steady dividend growth.
✅ Payout Ratio
The payout ratio provides insight into the sustainability of a company's dividend. Comfort Systems has EPS-based and FCF-based ratios at 5.60% and 4.96% respectively, reflecting a conservative payout approach.
| Key Figure | Ratio |
|---|---|
| EPS-based | 5.60 % |
| Free cash flow-based | 4.96 % |
Both EPS and FCF payout ratios highlight a prudent strategy, suggesting that the company's earnings are more than sufficient to cover its dividend obligations.
⚠️ Cashflow & Capital Efficiency
Cashflow stability and capital efficiency are crucial for evaluating the company's capacity to fund its growth and provide shareholder returns. Analyzing these parameters indicates a sound financial health.
| Metric | 2023 | 2024 | 2025 |
|---|---|---|---|
| Free Cash Flow Yield | 7.40% | 4.87% | 3.12% |
| Earnings Yield | 4.39% | 3.45% | 3.10% |
| CAPEX to Operating Cash Flow | 14.82% | 13.08% | 13.05% |
| Stock-based Compensation to Revenue | 0.25% | 0.237% | 0.239% |
| Free Cash Flow / Operating Cash Flow Ratio | 85.17% | 86.92% | 86.94% |
The company exhibits commendable cash flow stability, supported by moderate CAPEX needs and prudent financial management.
📉 Balance Sheet & Leverage Analysis
A robust balance sheet with manageable debt levels contributes to financial stability, especially during economic downturns. Comfort Systems maintains a strong balance sheet with favorable leverage ratios.
| Metric | 2023 | 2024 | 2025 |
|---|---|---|---|
| Debt-to-Equity | 20.09% | 18.10% | 32.10% |
| Debt-to-Assets | 7.77% | 6.55% | 12.20% |
| Debt-to-Capital | 16.73% | 15.33% | 24.30% |
| Net Debt to EBITDA | 0.108 | -0.295 | -0.136 |
| Current Ratio | 1.11 | 1.08 | 1.21 |
| Quick Ratio | 1.07 | 1.06 | 1.19 |
| Financial Leverage | 2.59 | 2.76 | 2.63 |
The balance sheet metrics confirm strong liquidity and prudent fiscal management, ensuring resilience against financial shocks.
💪 Fundamental Strength & Profitability
High Return on Equity and stable margins are indicators of operational efficiency and profitability. The company’s profitability ratios emphasize its capacity to deliver shareholder returns.
| Year | ROE | ROA | Net Margin | EBIT Margin | EBITDA Margin | Gross Margin |
|---|---|---|---|---|---|---|
| 2023 | 25.31% | 9.78% | 6.21% | 7.63% | 9.19% | 19.02% |
| 2024 | 30.65% | 11.09% | 7.43% | 9.56% | 11.63% | 21.01% |
| 2025 | 41.76% | 15.88% | 11.23% | 14.31% | 15.87% | 24.13% |
The company exhibits strong profitability metrics reinforced by consistent margin improvements across multiple fiscal years.
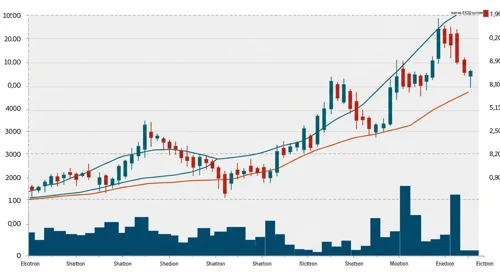
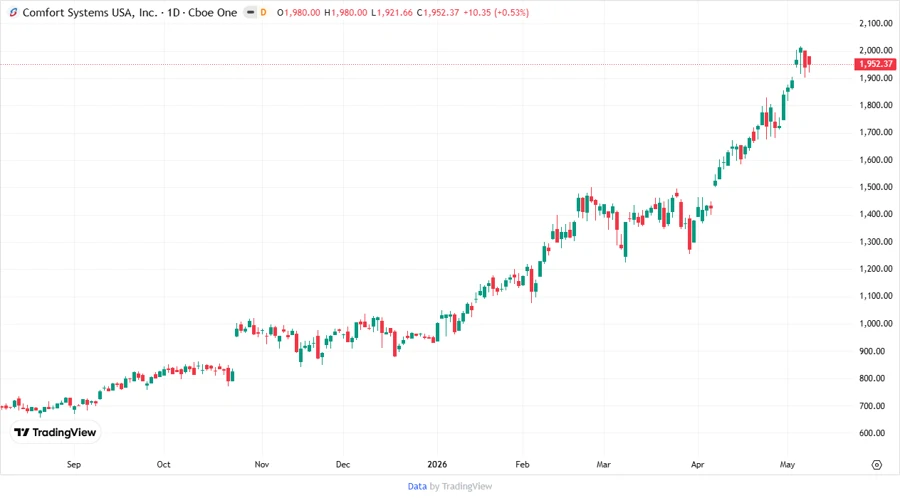
📊 Price Development
📋 Dividend Scoring System
| Criteria | Score (1-5) | Score Bar |
|---|---|---|
| Dividend yield | 2 | |
| Dividend Stability | 5 | |
| Dividend growth | 4 | |
| Payout ratio | 5 | |
| Financial stability | 4 | |
| Dividend continuity | 5 | |
| Cashflow Coverage | 4 | |
| Balance Sheet Quality | 5 |
Overall Score: 34 / 40
🔍 Rating
Comfort Systems USA, Inc. merits a strong endorsement as a dividend stock. It is recommended for investors seeking sustained income streams, backed by solid financial health, and long-term stability. Though the current yield may appear low, its financial discipline and growth outlook present a compelling investment case.
Smart Data Insight
Master the Perfect Entry & Exit for this Stock
Don't leave your profits to chance. Historically, this stock follows specific seasonal patterns that institutional traders use to maximize returns.
- ✅ Identify the "Golden Buying Window"
- ✅ Avoid high-risk correction cycles
- ✅ Backtested data from the last 20+ years