March 01, 2026 a 12:46 pm
📊 Dividend Analysis - Comfort Systems USA, Inc.
Comfort Systems USA, Inc. has maintained a robust dividend profile over the years, supported by strong earnings and cash flow. This company exhibits a consistent dividend history with steady growth, aligning with stable financial health as seen through its profitability and leverage metrics. With a low payout ratio and strong capital efficiency, Comfort Systems USA, Inc. positions itself well for sustainable dividend payments in the long run.
🗣️ Overview
Comfort Systems USA, Inc. operates in the construction and engineering sector, which is characterized by significant capital expenditures and revenue stability. The company’s dividend yield stands at 0.16%, complemented by a current dividend of 1.95 USD per share. With a 22-year history of dividend payments and no recent cuts or suspensions, investors can expect reliable income streams.
| Metric | Detail |
|---|---|
| Sector | Construction & Engineering |
| Dividend yield | 0.16% |
| Current dividend per share | 1.95 USD |
| Dividend history | 22 years |
| Last cut or suspension | None |
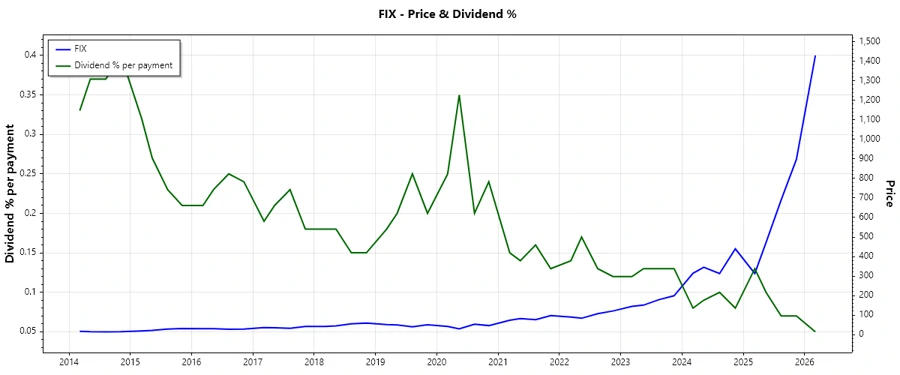
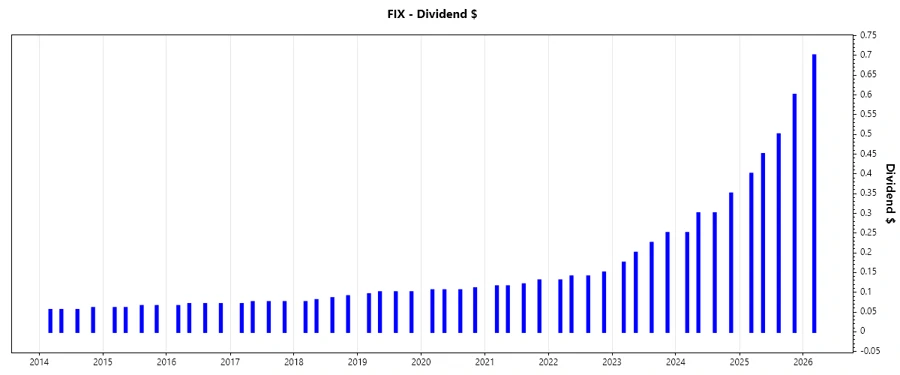
📈 Dividend History
Comfort Systems USA, Inc. has a long-standing commitment to returning capital to shareholders, evidenced by a strong record of 22 consecutive years of payout. This consistent history underpins investor trust and reflects corporate stability. A reliable dividend history is crucial for investors as it demonstrates a company’s dedication to sharing profits with shareholders, even through economic cycles.
| Year | Dividend per Share (USD) |
|---|---|
| 2026 | 0.70 |
| 2025 | 1.95 |
| 2024 | 1.20 |
| 2023 | 0.85 |
| 2022 | 0.56 |
📉 Dividend Growth
Over the past 3 and 5 years, Comfort Systems USA, Inc. has delivered consistent dividend growth, reflecting management's confidence in future cash flows and profitability. Understanding the growth trajectory is essential for assessing future income potential from an investment.
| Time | Growth |
|---|---|
| 3 years | 51.57% |
| 5 years | 35.62% |
The average dividend growth is 35.62% over 5 years. This shows moderate but steady dividend growth, indicating the company’s strong emphasis on enhancing shareholder value.
✅ Payout Ratio
The payout ratio is a critical measure of a company’s ability to sustain its dividend payments. For Comfort Systems USA, Inc., both EPS-based and free cash flow-based payout ratios are maintained at a healthy level, indicative of efficient profit retention for reinvestment and dividend distribution.
| Key figure | Ratio |
|---|---|
| EPS-based | 6.71% |
| Free cash flow-based | 6.66% |
The low payout ratios suggest that the company retains a significant portion of its earnings, contributing to potential future growth and dividend sustainability, alongside indicating a conservative dividend approach.
🔍 Cashflow & Capital Efficiency
The financial performance underpins Comfort Systems USA, Inc.’s capacity to generate cash and reinvest efficiently, crucial for dividend sustainability and growth. Strong capital efficiency metrics alongside disciplined cash flow management ensure that the company is not only generating sufficient cash but also deploying it effectively for expansion and shareholder returns.
| Metric | 2025 | 2024 | 2023 |
|---|---|---|---|
| Free Cash Flow Yield | 3.13% | 4.88% | 7.40% |
| Earnings Yield | 3.10% | 3.45% | 4.39% |
| CAPEX to Operating Cash Flow | 13.06% | 13.08% | 14.83% |
| Stock-based Compensation to Revenue | 0.24% | 0.24% | 0.25% |
| Free Cash Flow / Operating Cash Flow Ratio | 86.94% | 86.92% | 85.17% |
The favorable yield and capital metrics illustrate Comfort Systems USA, Inc.’s proficiency in converting operating cash flow into free cash flow and leveraging it, ensuring robustness to fund dividends and sustain strategic growth.
📉 Balance Sheet & Leverage Analysis
A solid financial foundation is essential to comfort dividend reliability. Comfort Systems USA, Inc. exhibits a conservative approach to debt and financial leverage, focusing on strong liquidity positions and capital structure optimization, which provides a safeguard for its dividend payments.
| Metric | 2025 | 2024 | 2023 |
|---|---|---|---|
| Debt-to-Equity | 0.32 | 0.18 | 0.20 |
| Debt-to-Assets | 0.12 | 0.07 | 0.08 |
| Debt-to-Capital | 0.24 | 0.15 | 0.17 |
| Net Debt to EBITDA | -0.14 | -0.30 | 0.11 |
| Current Ratio | 1.21 | 1.08 | 1.11 |
| Quick Ratio | 1.19 | 1.06 | 1.07 |
| Financial Leverage | 2.63 | 2.76 | 2.59 |
The low leverage and ample liquidity provided by the solid balance sheet underscore the company's capacity to withstand financial adversities, while maintaining consistent and growing dividend distributions.
📐 Fundamental Strength & Profitability
The profitability measures of Comfort Systems USA, Inc. are indicative of strong operational excellence and a strategic emphasis on margin improvement. The sturdy profit margins and return metrics reflect the company’s capacity to generate substantial earnings relative to its equity base and asset deployments.
| Metric | 2025 | 2024 | 2023 |
|---|---|---|---|
| Return on Equity | 41.76% | 30.65% | 25.31% |
| Return on Assets | 15.88% | 11.09% | 9.78% |
| Margins: Net | 11.23% | 7.43% | 6.21% |
| Margins: EBIT | 14.31% | 9.56% | 7.63% |
| Margins: EBITDA | 15.87% | 11.63% | 9.19% |
| Margins: Gross | 24.13% | 21.01% | 19.02% |
With robust profitability indicators and margin capabilities, Comfort Systems USA, Inc. is poised to maintain dividend growth driven by internal efficiencies and revenue enhancements.
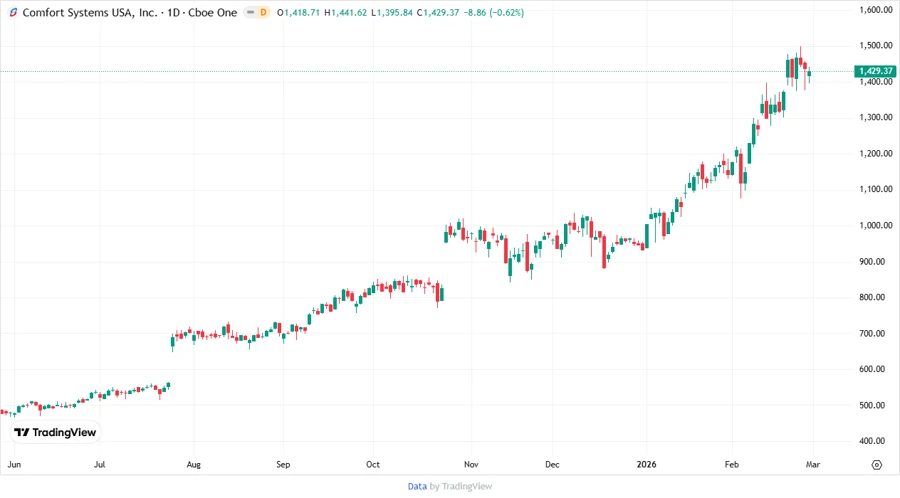
⬆️ Price Development
The price trends of Comfort Systems USA, Inc. signify positive market sentiment, driven by consistent dividend growth and solid financial performance. The resilient pricing environment enhances investor confidence in the sustained appreciation potential of the stock.
📋 Dividend Scoring System
| Category | Score | Score Bar |
|---|---|---|
| Dividend yield | 3 | |
| Dividend Stability | 5 | |
| Dividend growth | 4 | |
| Payout ratio | 5 | |
| Financial stability | 4 | |
| Dividend continuity | 5 | |
| Cashflow Coverage | 4 | |
| Balance Sheet Quality | 5 |
Total Score: 35/40
🔍 Rating
Comfort Systems USA, Inc. demonstrates a stellar dividend profile underpinned by robust financial metrics, superior management of cash flow, and a commendable dividend history. While the current yield is moderate, the stability and growth promise potential value appreciation. Investors seeking a reliable income stream coupled with potential capital growth may find this stock an attractive addition to their portfolios.
Smart Data Insight
Master the Perfect Entry & Exit for this Stock
Don't leave your profits to chance. Historically, this stock follows specific seasonal patterns that institutional traders use to maximize returns.
- ✅ Identify the "Golden Buying Window"
- ✅ Avoid high-risk correction cycles
- ✅ Backtested data from the last 20+ years